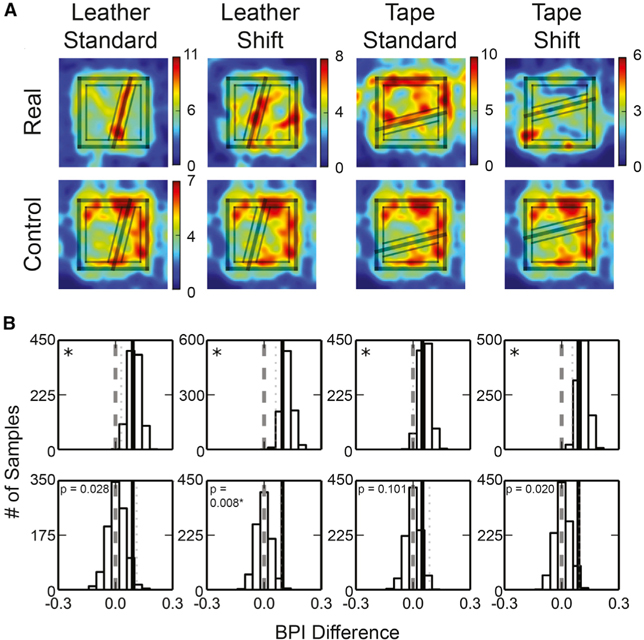
Figure 5. Place Field Edges Concentrated Near the Surface Boundaries.
(A) The place-field-edge density maps of the simple boards (top) and the control plain board with zone markings from the corresponding simple boards (bottom). The rim of the platform and the cue boundary are labeled by thick lines, and the boundary and nonboundary zones used in the analyses are labeled by thin lines. Color bar indicates field-edge density (number of field edges per bin).
(B) The bootstrapped distributions (top) and the permutation distributions (bottom) of the BPI differences. The figure formats are as described in Figure 2. *Significant at a = 0.05, Bonferroni corrected for 4 comparisons.
See also Figure S4B.

