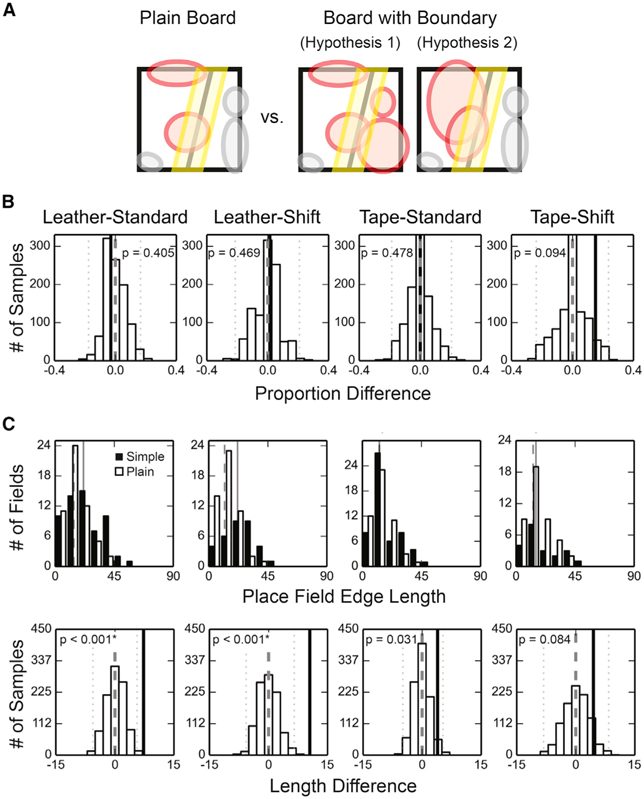
Figure 6. Adjacent Fields Extending along the Surface Boundaries.
(A) Schematics of different hypotheses explaining why the BPI difference was larger on the experiment boards than on the plain board. Hypothesis 1 suggests that a higher proportion of place fields were observed within the boundary zone on the simple boards than on the plain board. Hypothesis 2 suggests that place fields tended to extend along the cue boundary on the simple boards, and thus the average length of field edges observed within the boundary zone was larger on the simple boards than on the plain board. The place fields are denoted by colored circles, and the red fields increase the field-edge density within the boundary zone.
B) The permutation test of the field proportion difference (no boards pass significance test at α = 0.05, two-tailed, with Bonferroni correction). The denotations are as described in Figure 2.
(C) Longer field edges were found near the surface boundaries on the leather boards than on the plain board. Top: the distributions of the field-edge lengths within the boundary zone. The distributions of the field-edge lengths collected from the simple boards are represented by black bars, with the median values denoted by the solid lines, and the distributions of the plain board control are represented by white bars, with the median values denoted by the dashed lines. The field-edge length of the leather boards were significantly larger than the plain board control (two-tailed Mann-Whitney U test, n is the number of fields, and m is the median of the contour lengths: leather-standard, ntexture = 59, nplain = 54, mtexture = 21.53, mplain = 14.27, U = 1099.0, p = 0.002*; leather-shift, ntexture = 33, nplain = 51, mtexture = 21.93, mplain = 12.06, U = 397.0, p < 0.001*; tape-standard, ntexture = 54, nplain = 50, mtexture = 12.94, mplain = 12.92, U = 1142.5, p = 0.089; tape-shift, ntexture = 21, nplain = 44, mtexture = 15.22, mplain = 13.07, U = 381.0, p = 0.129; α = 0.05 with Bonferroni correction). Bottom: the permutation test of the edge length difference. The denotations are as described in Figure 2.

