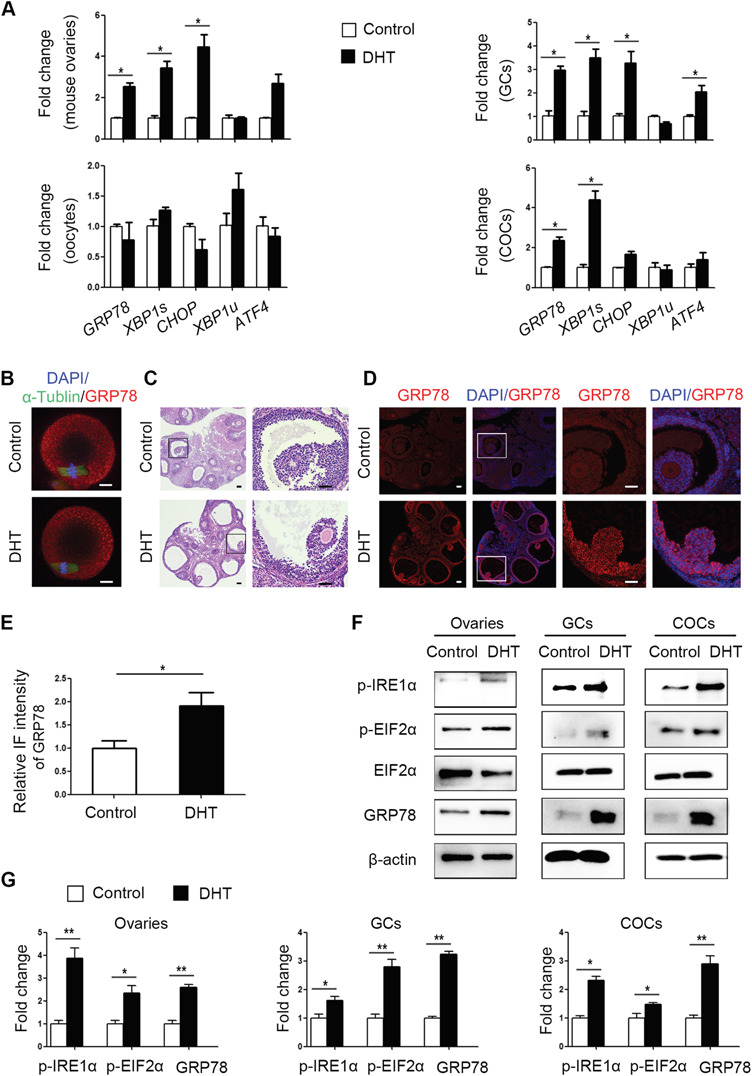
Figure 2.

Expression patterns of unfolded protein response (UPR) genes and proteins in ovaries, cumulus oocyte complexes (COCs), oocytes and granulosa cells (GCs) of control and dihydrotestosterone (DHT)-treated polycystic ovary syndrome (PCOS) mice (n = 8 per treatment group). (A) GRP78, XBP1s, XBP1u, CHOP and ATF4 mRNA expression levels in whole ovarian tissues, COCs, GCs and denuded oocytes were analysed by real-time qPCR, and the relative fold changes were calculated by normalization to the levels of Gapdh. The data are presented as means ± SEMs. *P < 0.05. (B) Representative immunofluorescence (IF) images for GRP78 protein (red) in metaphase II oocytes from DHT-treated and control mice, with co-staining for FITC-α-tubulin (green, spindle) and DAPI (blue, chromosomes). Scale bar: 20 μm. (C) Histology of control and DHT-treated mouse ovaries. Scale bar: 100 μm. (D) Representative IF results showing GRP78 expression levels in control and DHT-treated mouse ovaries. Scale bar: 100 μm. (E) The relative intensities of IF levels calculated using ImageJ software in the two groups. The data are presented as means ± SEMs. *P < 0.05. (F) Western blot results for p-IRE1α, p-EIF2α, total EIF2α and GRP78 protein levels in the ovaries, COCs and GCs of control and PCOS mice. (G) The band intensities were determined with ImageJ software and normalized to those of β-actin, except for those of p-EIF2α, which were normalized to those of total EIF2α. The data are presented as means ± SEMs. *P < 0.05, **P < 0.01. DHT, dihydrotestosterone; COCs, cumulus-oocyte complexes; GCs, granulosa cells; IF, immunofluorescence.
