
Figure 6.
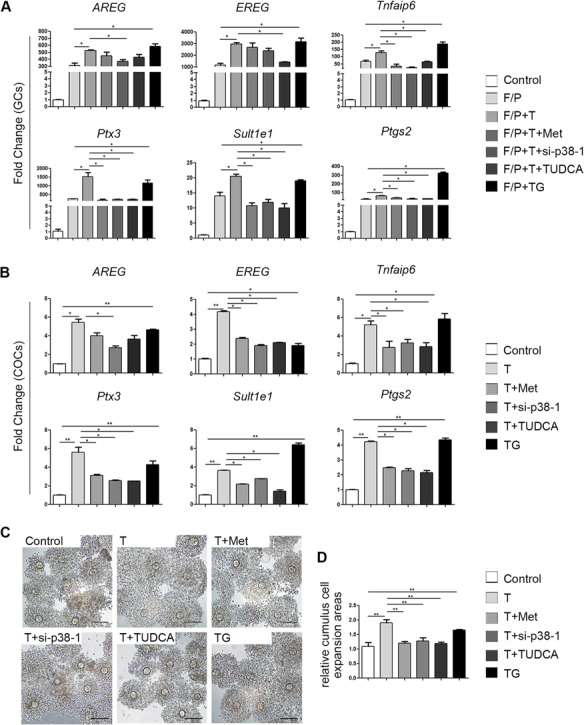
Effects of testosterone together with other drugs on LH responses in cultured granulosa cells (GCs) and cumulus oocyte complexes (COCs). (A) Real-time qPCR results showing the mRNA levels of the indicated genes (Areg, Ereg, Tnfaip6, Ptx3, Sult1e1 and Ptgs2) in cultured GCs treated with 10 μM testosterone (T), 1 mM metformin (met), si-p38 MAPK, or 1 mg/ml tauroursodeoxycholic acid (TUDCA; an ER stress inhibitor) for 24 h or with 1 μM thapsigargin (TG; an ER stress inducer) for 1 h before treatment with forskolin (F; 10 μM) plus phorbol 12-myristate 13-acetate (P; 20 nM) for 4 h. The data are presented as means ± SEMs. *P < 0.05. (B) Real-time qPCR results showing mRNA levels in cultured COCs after different treatments. The levels of specific mRNAs were normalized to the Gapdh signals. The data are presented as means ± SEMs. *P < 0.05, **P < 0.01. (C) COCs expansion after in vitro maturation in medium containing 10 μM testosterone and the drugs described above. (D) Histograms of the COC expansion areas made with ImageJ software. The data are presented as means ± SEMs. **P < 0.01. Scale bar = 100 μm. GCs, granulosa cells; COCs, cumulus-oocyte complexes; F/P, forskolin and phorbol 12-myristate 13-acetate; T, testosterone; Met, metformin; TUDCA, tauroursodeoxycholic acid; TG, thapsigargin.