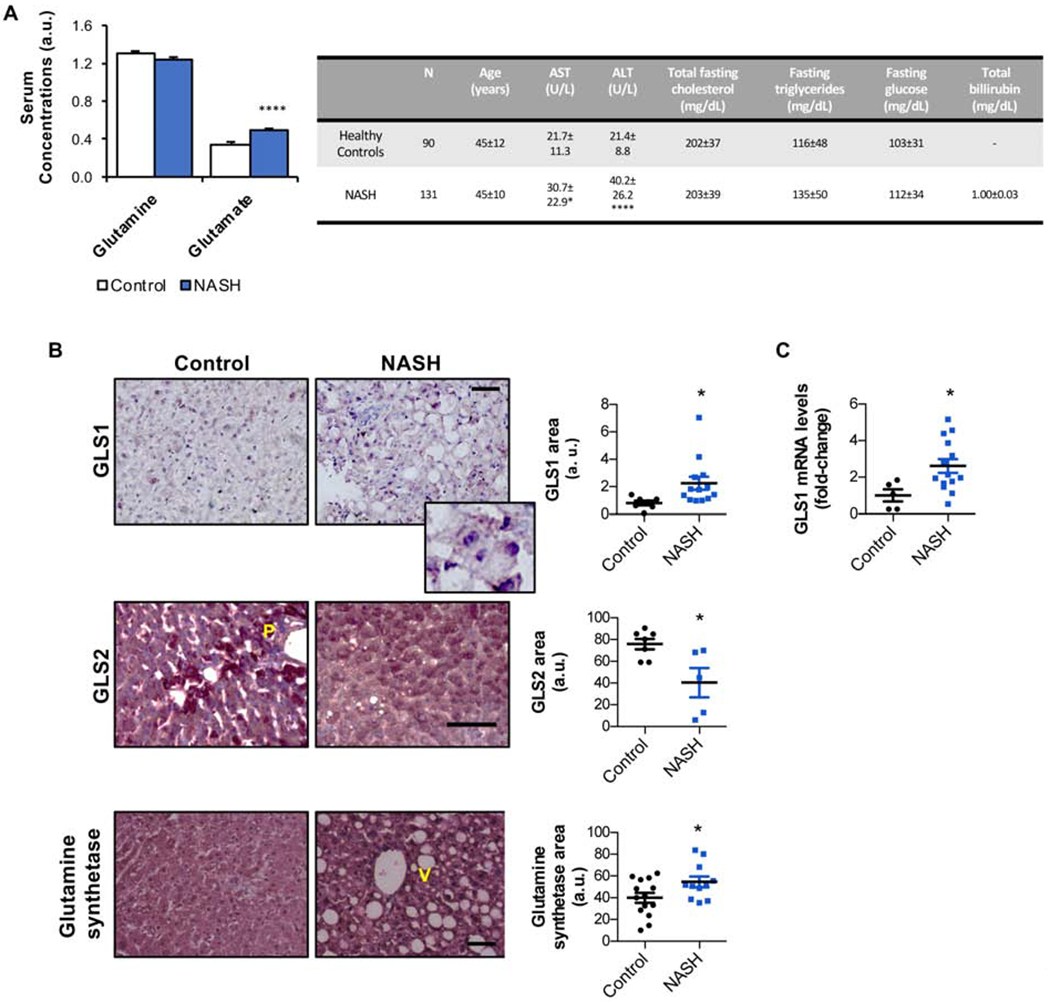
Figure 1. Glutaminase 1 (GLS1) is overexpressed in clinical non-alcoholic steatohepatitis (NASH).

A. Serum levels of glutamine and the product of glutamine catabolism, glutamate, in a large cohort of patients diagnosed with NASH (n= 131) relative to a control group of healthy subjects (n= 90). A table showing the main serum biochemical parameters relative to these patients is shown. B. Liver immunohistochemical staining and respective quantification for the isoform 1 of glutaminase (GLS1), and inset zoom, the isoform 2 of glutaminase (GLS2) and glutamine synthetase in another cohort of NASH patients (n= 13) versus a control group of healthy subjects (n= 13). Scale bar corresponds to 100 μm. V-venous region; P-portal region. C. mRNA levels of GLS1 in a cohort of NASH patients (n=16) against a control group of age- and body-weight matched healthy controls (n=5). Data is shown as average ± SEM and Student’s t-test was used to compare groups. *p<0.05 and ****p<0.0001 against the control group are shown (See also Table S1).
