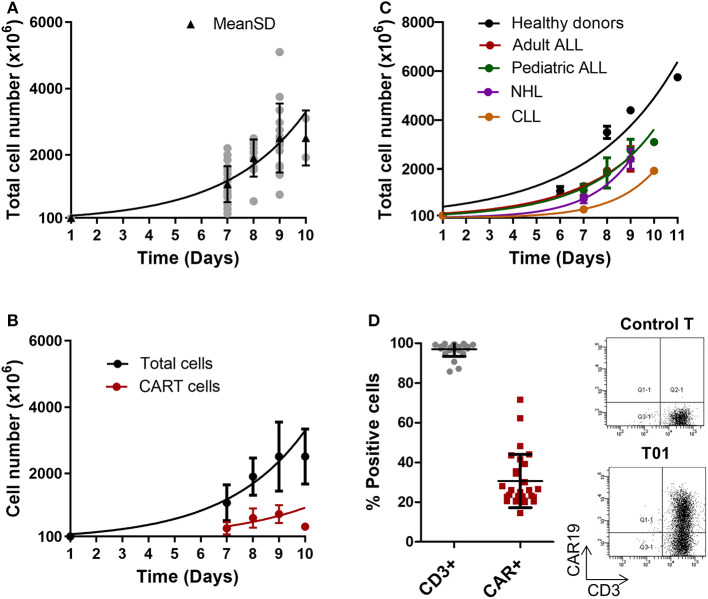
Figure 1.
ARI-0001-cell expansion in CliniMACS Prodigy. (A) Expansion kinetics of ARI-0001-cell products (Total cell number). Gray points indicate individual products. Black triangles indicate Mean ± SD and adjusting curve. (B) Expansion kinetics of CAR19+ cells (red) and total cell number (black). Mean ± SD is represented. (C) Expansion kinetics of ARI-0001 cells (Total cell number) comparing healthy controls and different types of disease. Mean ± SEM is represented. (D) Percentage of CD3 and CAR19 positive cells as determined by flow cytometry. Mean ± SD is also indicated. Panels on the right show flow cytometry representative image corresponding to CAR19 and CD3 staining in ARI-0001-cell final products and Control T cells (Untransduced).

