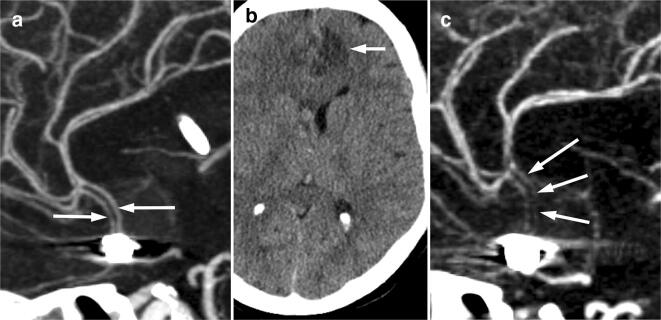
Fig. 2.
CT angiogram 4 days after presentation (a), maximum intensity projection in the sagittal plane shows patency of the anterior cerebral arteries (arrows). Non-enhanced CT brain 8 days after presentation, b shows a new acute infarct in the left anterior cerebral artery territory (arrow). CT angiogram 8 days after presentation, c shows severe narrowing of the anterior cerebral artery A2 segments bilaterally (arrows)

