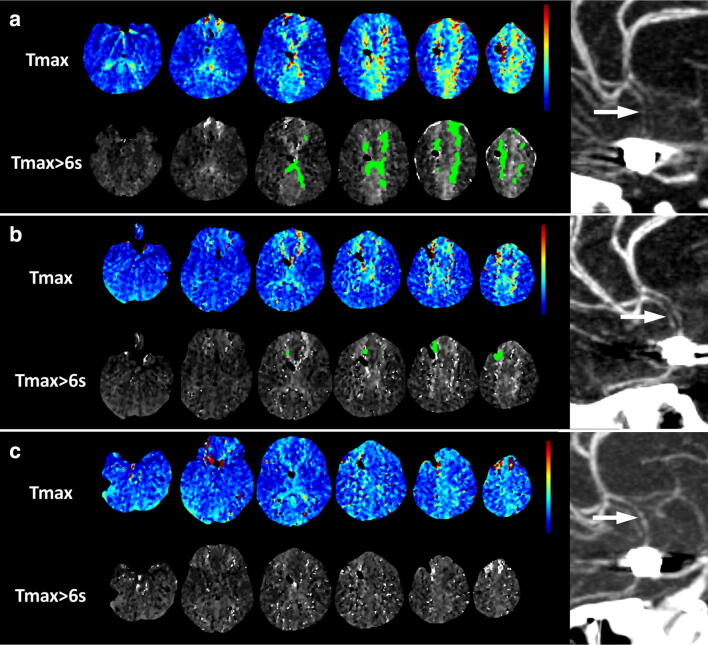
Fig. 3.
Serial CT perfusion maps and CT angiography during milrinone and induced hypertensive therapy. Perfusion map before milrinone and hypertensive treatment, a (8 days after presentation) shows increased Tmax (top row) in the anterior cerebral artery territories bilaterally. Using a threshold of Tmax > 6 s, there is 40 mL of tissue with abnormal perfusion (bottom row). CTA shows severe narrowing of the anterior cerebral artery A2 segments (arrow). Perfusion map after initiation of milrinone and induced hypertension, b (9 days after presentation) shows reduced extent and severity of the Tmax elevation (top row), and 4 mL of tissue with abnormal perfusion (bottom row). CTA shows possibly mild improvement in the caliber of the anterior cerebral arteries (arrow). Perfusion map 48 h after initiation of milrinone and induced hypertension at 10 days, c shows complete normalization of Tmax, and no tissue with abnormal perfusion (bottom row). CTA shows no change in the caliber of the anterior cerebral artery A2 segments (arrow)

