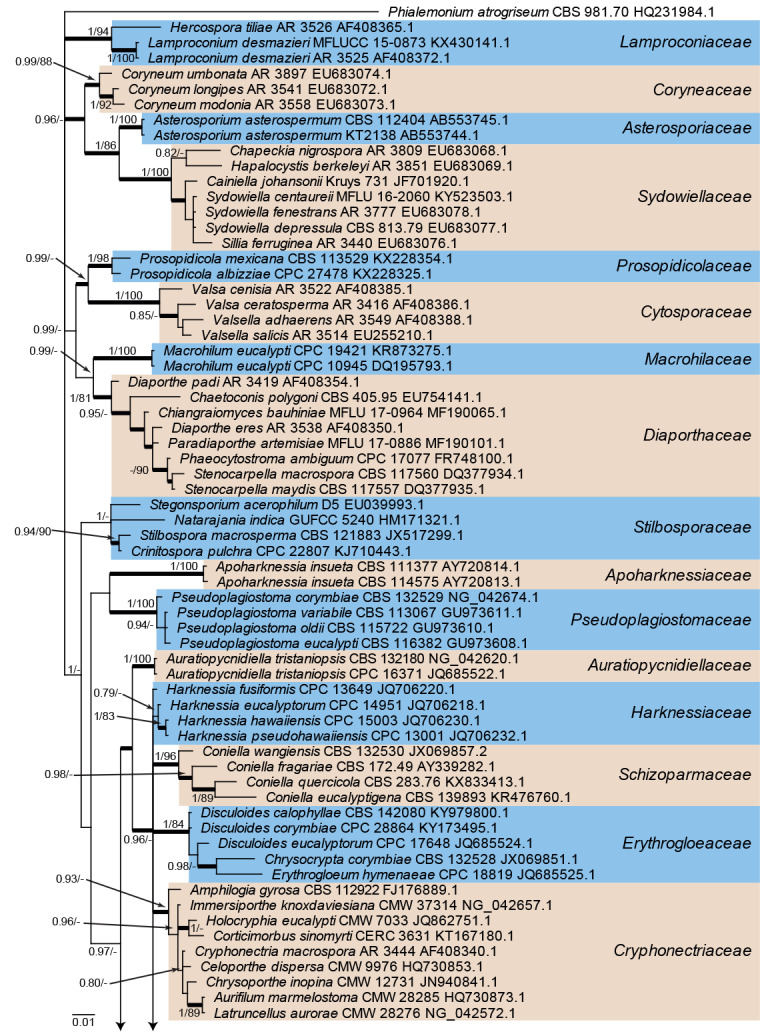
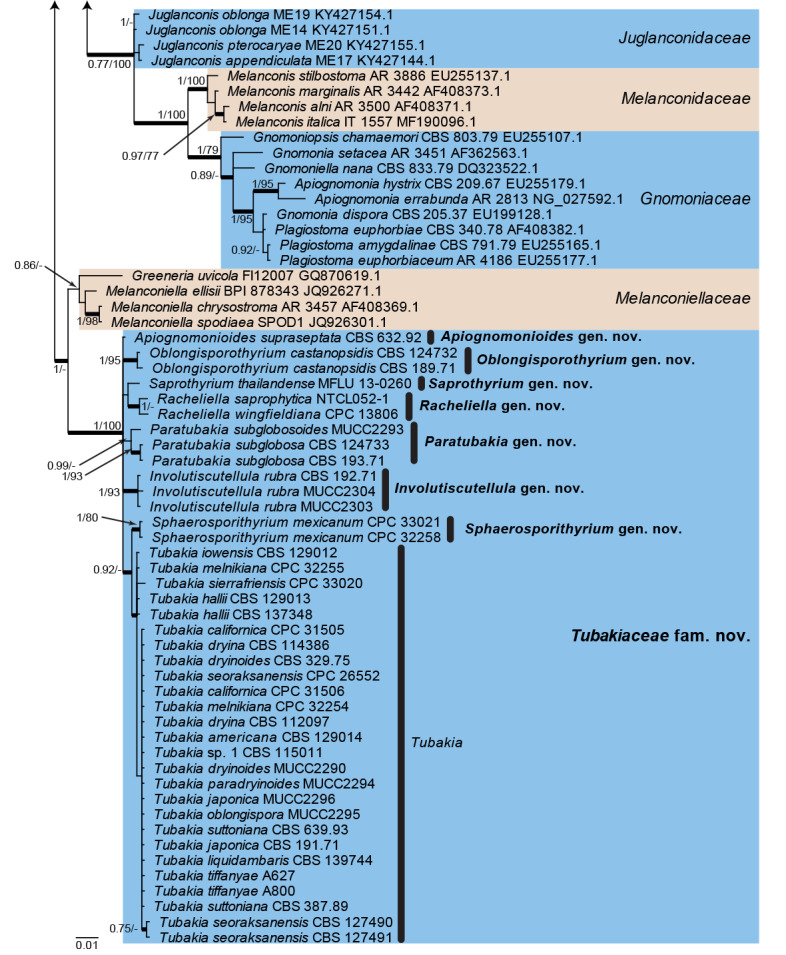
Fig. 1.


Consensus phylogram (50 % majority rule) from a Bayesian analysis of the LSU sequence alignment. Bayesian posterior probabilities (PP) >0.74 and maximum parsimony bootstrap support values (MP-BS) >74 % are shown at the nodes (PP/MP-BS) and thickened lines represent those branches present in the strict consensus maximum parsimony tree. The scale bar represents the expected changes per site. Families are indicated with coloured blocks to the right of the tree and the genera in Tubakiaceae are highlighted on the tree. Culture/specimen and GenBank accession numbers are indicated behind the species names. The tree is rooted to Phialemonium atrogriseum (GenBank HQ231984.1) and the novel family and genera are indicated in bold face.
