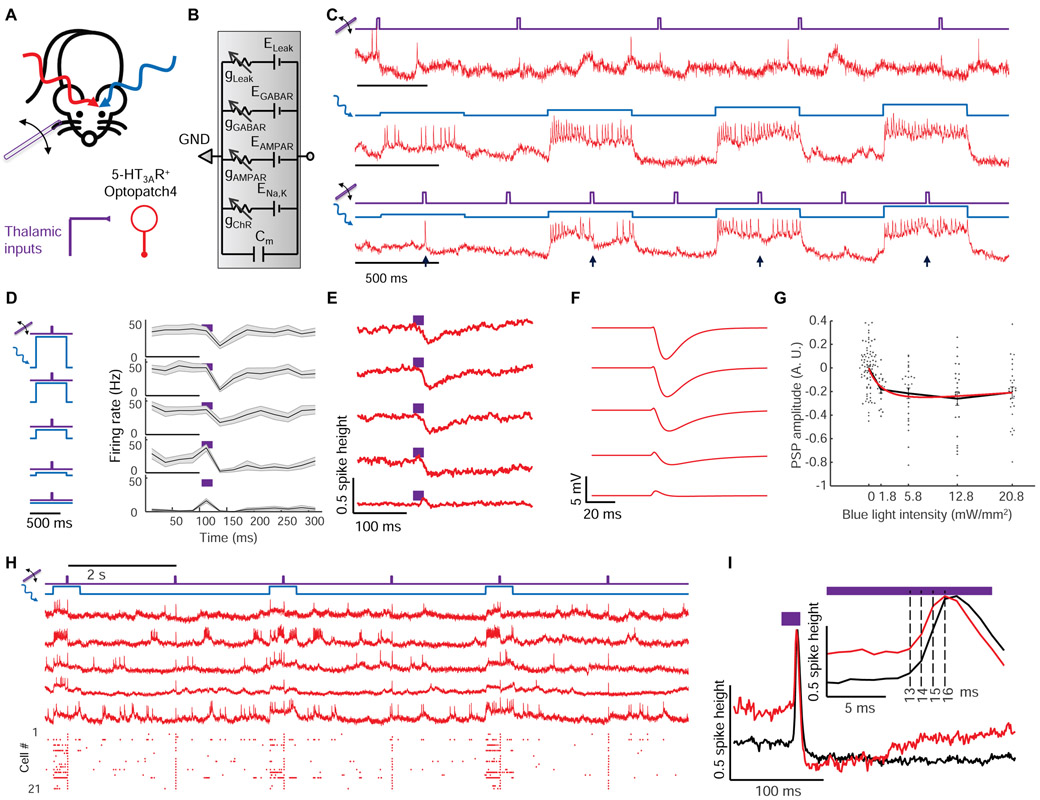
Figure 3. Optical dissection of excitation and inhibition in L1 interneurons in awake mice.
(A) Whisker stimuli and single cell-targeted optogenetic stimuli were paired in 5HT3AR-Cre mice expressing Optopatch4. (B) Conductance-based model of subthreshold membrane potential. This simple model only contained passive conductances, with gating by light (Channelrhodopsin, ChR), glutamate (AMPAR), and GABA (GABAR). A leak conductance set the resting potential. (C) Three recordings from a single neuron showing response to (top) whisker stimulus, (middle) targeted optogenetic stimulus, and (bottom) simultaneous optogenetic and whisker stimuli. Arrows show whisker stimulus-evoked inhibition. (D) Mean spike rate evoked by whisker stimuli atop different levels of targeted optogenetic depolarization. In the absence of optogenetic stimulation, whisker stimuli evoked precisely timed single spikes. In the presence of optogenetic stimulation, whisker stimuli suppressed spiking. The suppression decreased in amplitude and duration as the strength of the optogenetic stimulus increased, a consequence of ChR shunting. Shading represents s.e.m. from n = 27 neurons, 4 mice. (E) Mean whisker stimulus-evoked subthreshold waveforms at different levels of optogenetic drive. Spikes were digitally removed prior to averaging (Methods). (F) Simulated membrane voltage waveforms under different levels of optogenetic drive, using the model shown in B. Excitation was assumed to lead inhibition by 2 ms (Methods). (G) Comparison of simulated (red) and measured (points) PSP amplitude as a function of optogenetic stimulus strength. (H) Repetitive measurements of whisker stimulus-evoked responses in anesthetized mice, with and without baseline optogenetic stimulation. Top: example recordings. Bottom: spike raster (n = 21 neurons, 3 mice). (I) Stimulus-triggered mean fluorescence responses without (black) and with (red) baseline optogenetic stimulation. Traces were aligned vertically to their peak. Inset: Magnified view showing dynamics near the peak.

