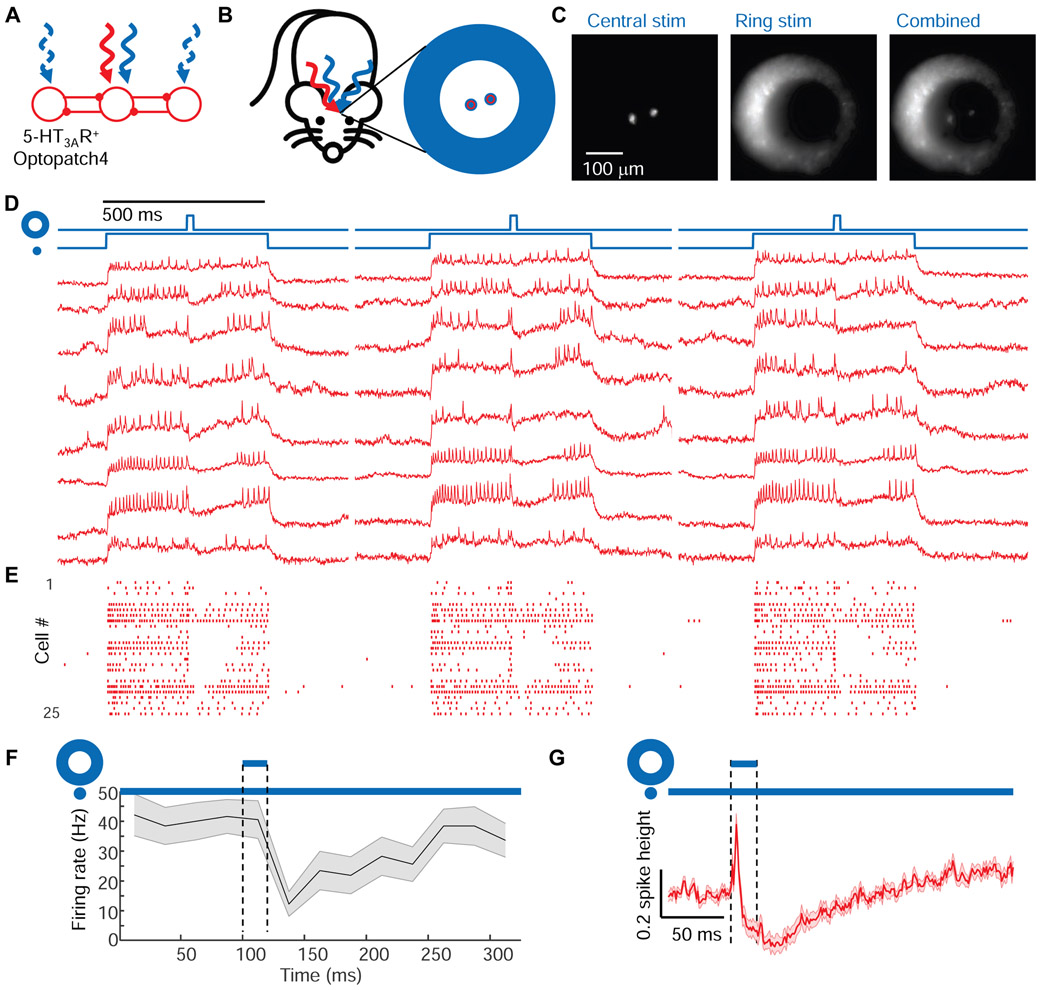
Figure 4. Center/surround optogenetic stimulation reveals lateral inhibition in barrel cortex L1.
(A) Simple model of L1 circuit with lateral inhibition. Tonic optogenetic depolarization increased the driving force for inhibitory currents in the central neuron. Pulsed optogenetic stimulation of the surrounding neurons (blue) evoked lateral inhibition, revealed by voltage imaging (red). (B) Configuration of stimulation and imaging spots to probe lateral inhibition in L1 of 5-HT3AR-Cre mice. (C) Epifluorescence images showing the illumination patterns in vivo. (D) Fluorescence waveforms from the central neurons under center/surround optogenetic stimulation. (E) Spike raster (n = 25 neurons, 3 mice). (F) Mean spike rate during central stimulation, before and after surround stimulation, n = 25 neurons, 3 mice. Shading represents s.e.m. (G) Mean subthreshold voltage in an optogenetically depolarized central neuron during, before and after surround stimulation. The initial voltage increase was due to scattered light from the surround stimulus (Fig. S2). Shading represents s.e.m.

