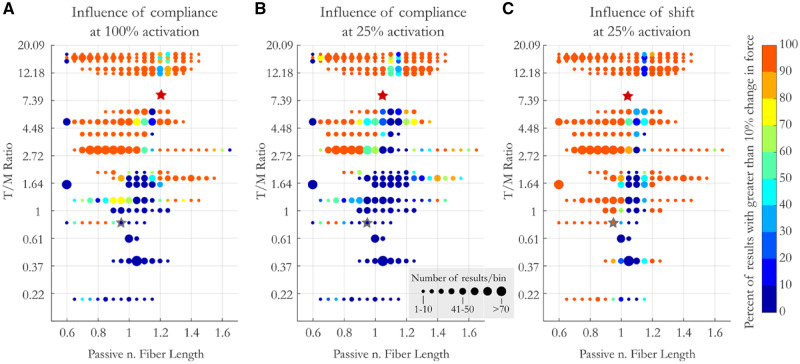
Fig. 6.
The influence of compliance (at 100% [A] and 25% activation [B]) and activation-dependent shifts in L0 on force production (at 25% activation [C]) as a function of MTU compliance and passive (pre-activation) muscle length. Color designates the percent of results that saw a greater than 10% change in force production between models. Circle size represents the number of samples per bin. Y-axis is non-linear to ease visualization of results at low MTU compliance. Stars represent average compliance and operating length of the muscles acting at the hip (gray) and ankle (red) in CNS (B) and CS (C) conditions.

