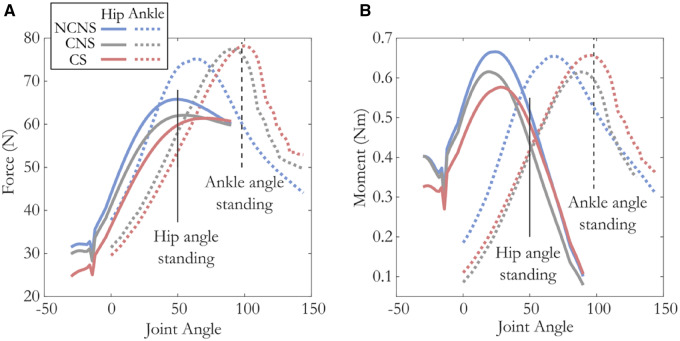
Fig. 7.
Joint angle vs. total force (A) and moment (B) acting across the hip (solid lines) and ankle (dashed lines) under three different muscle–tendon models. Average weighted moment arms for the hip (solid) and ankle (dashed) depicted in orange. While at the hip, the posture that produces maximum force and moment does not vary much between models (<9°), the maximum force and moment capacity decreases with both compliance and activation-dependent shift in L0 (∼13%). In contrast, at the ankle the magnitude of maximum force and torque varies little between models (<3%), but the posture at which this maximum occurs varies by almost 40°. Vertical lines represent the hip (solid) and ankle (dashed) postures during standing.

