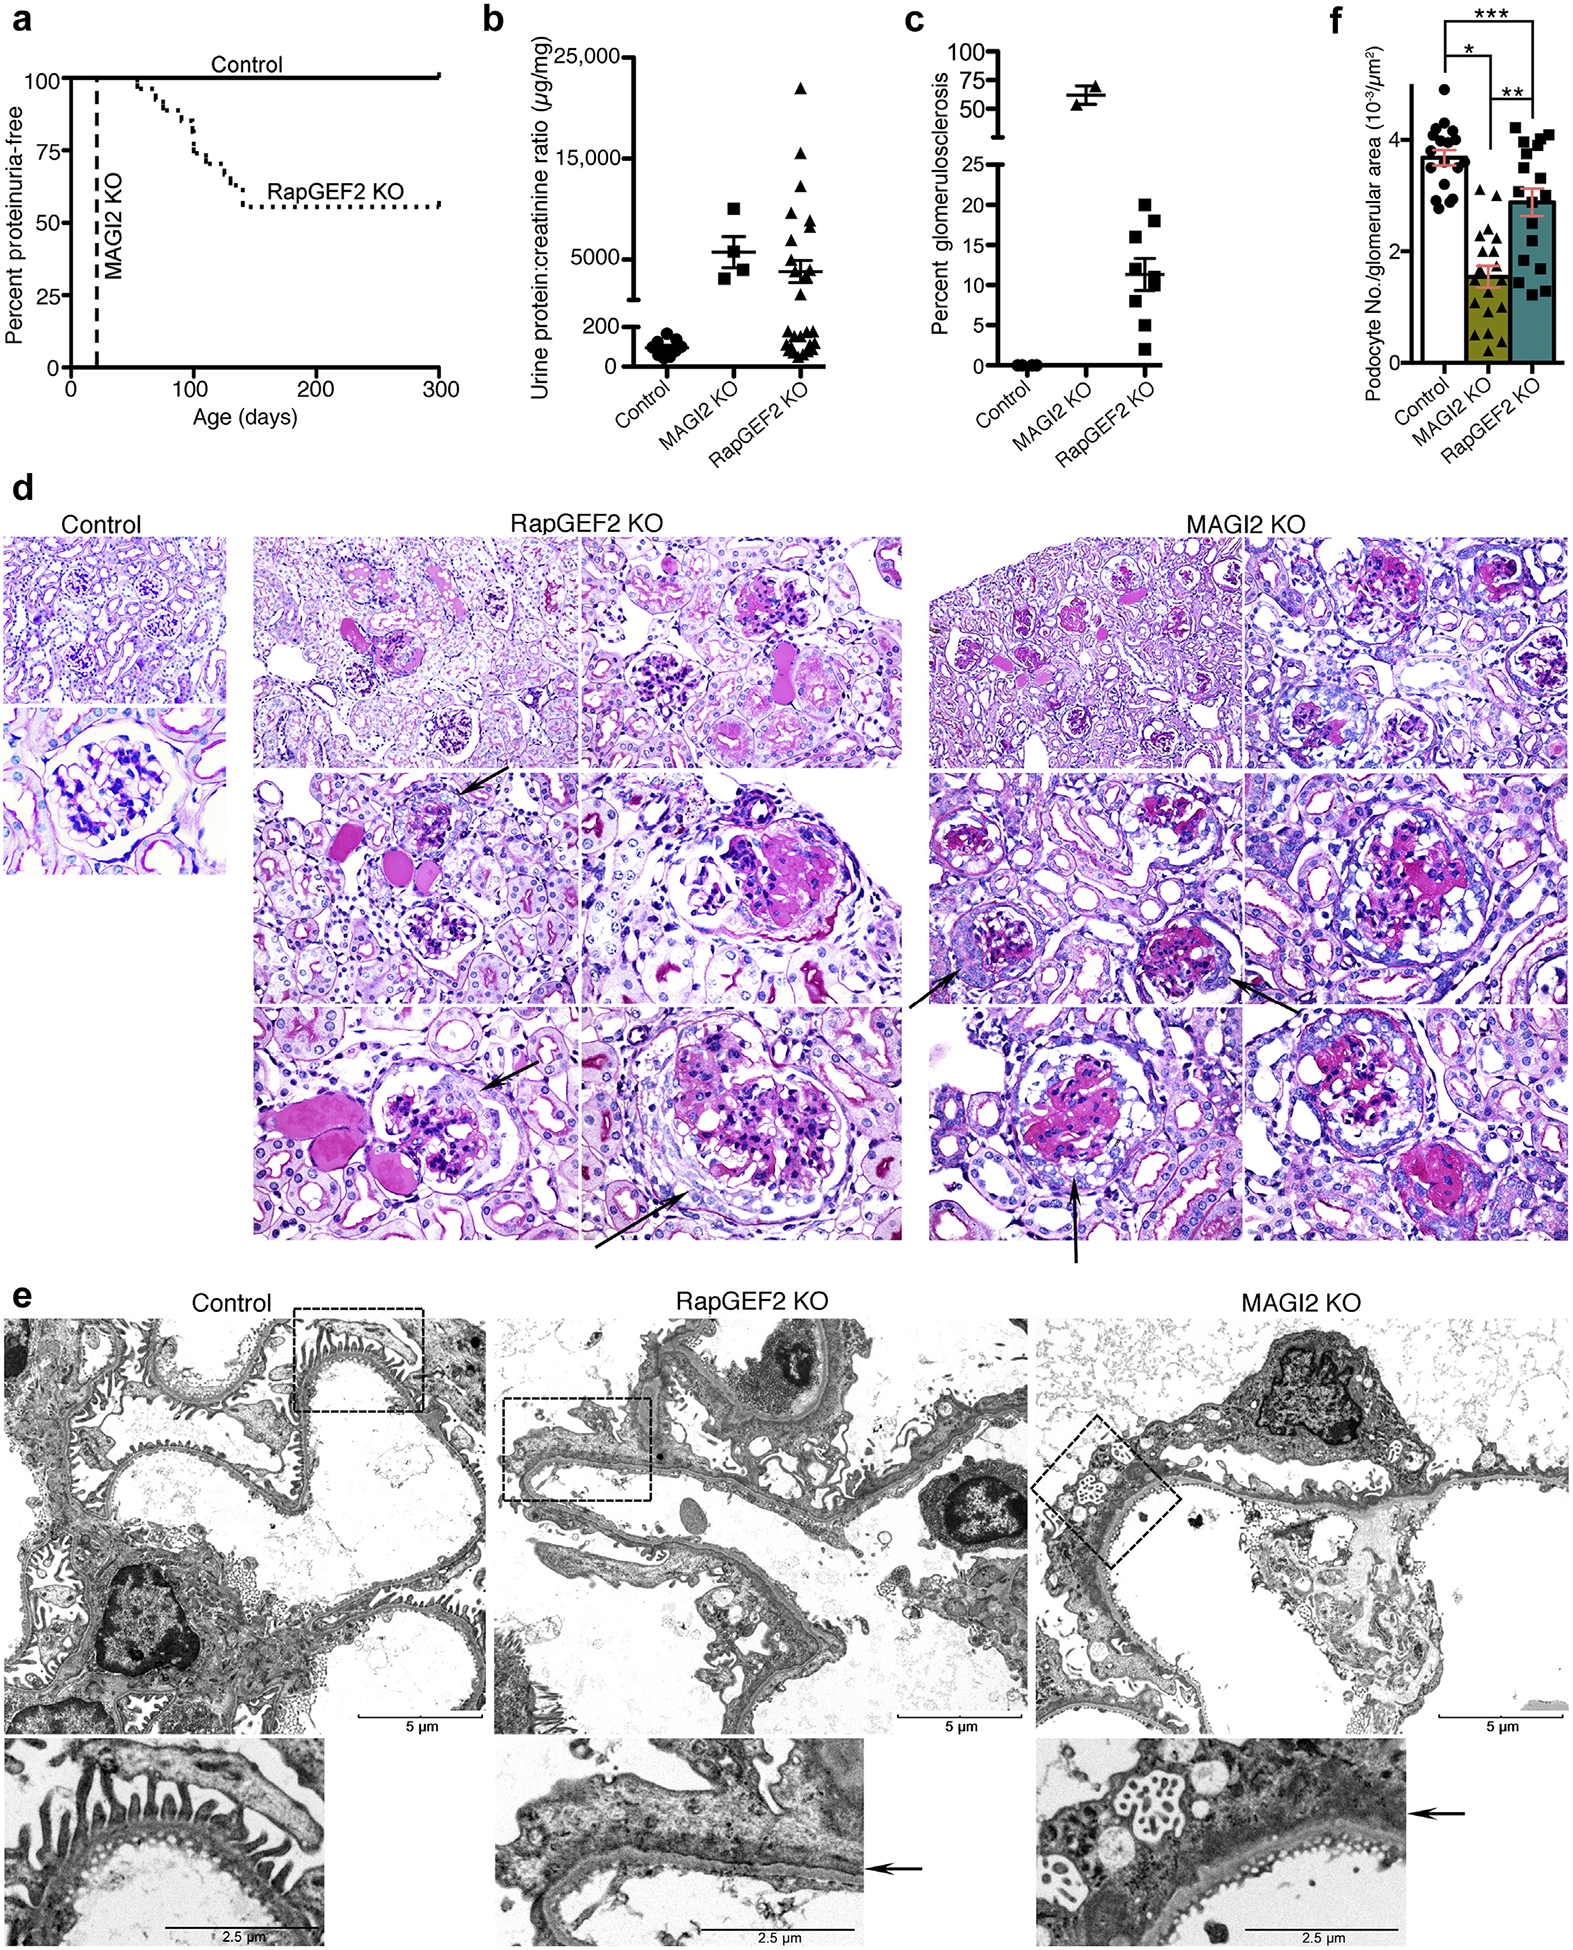
Figure 4 |. odocyte-specific RapGEF2 knockout (KO) mice develop focal segmental glomerulosclerosis (FSGS) with comparable qualitative glomerular features compared with membrane-associated guanylate kinase 2 (MAGI2) KO mice.

(a) Survival curve showing age of onset of proteinuria. Urine protein:creatinine ratios were measured weekly with the onset of proteinuria defined by a protein:creatinine ratio of greater than 400 mg/mg for 2 consecutive weeks. (b) Calculated protein:creatinine ratios for RapGEF2 KO mice (n = 12, at age 20 weeks or at the time they were killed) and global MAGI2 KO mice (n = 4, age 5 weeks). Severe proteinuria develops in both models. (c) For each mouse with proteinuria, the percentage of glomeruli demonstrating glomerulosclerosis on periodic acid–Schiff staining was calculated. (d) Comparative pathologic analysis of proteinuric RapGEF2 KO mice (age 12 weeks) with MAGI2 KO mice (age 5 weeks). Both models demonstrate focal segmental and global glomerulosclerosis, mesangial expansion, and parietal cell proliferation with pseudocrescent formation. Original magnification for control: upper, ×200; lower, ×600. Original magnification for RapGEF2 and MAGI2 KO: upper left, ×200; upper right and middle left, ×400; middle right and lower left and right, ×600. Arrow shows parietal cell proliferation with pseudocrescent. (e) Electron microscopy reveals comparable qualitative features between proteinuric podocyte-specific RapGEF2 KO and MAGI2 KO mice. Both show diffuse foot process effacement, actin cytoskeletalmatting parallel to the glomerular basement membrane, and simplification and loss of primary and secondary processes. Bar = low power, 5 μm; high power, 2.5 mm. Arrow shows actin cytoskeletal matting present in both models. (f) Podocyte loss was evident in both MAGI2 and proteinuric RapGEF2 KO mice. The number of Wilms tumor 1 (WT1)–positive cells per glomerular tuft area was determined for glomeruli where the macula densa was clearly evident; n = 3 mice per group, with 18 total glomeruli analyzed for each group (*P < 0.0001, **P < 0.0002, ***P < 0.008).
