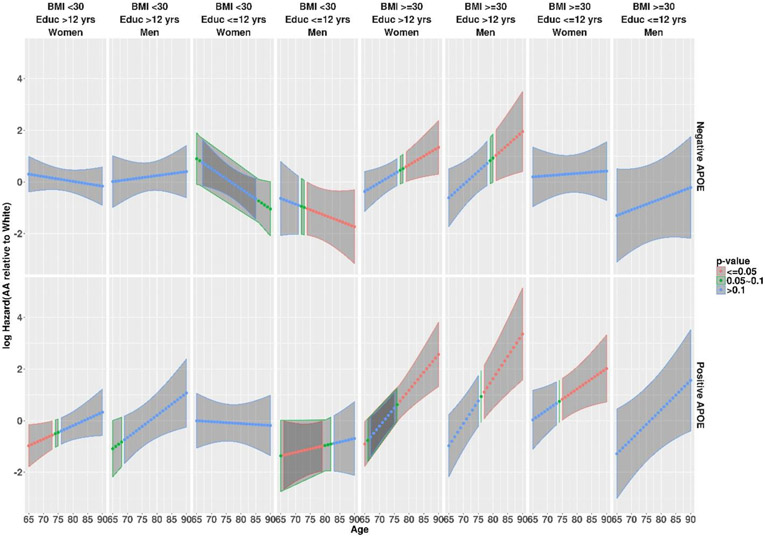
Figure 2.
Estimated racial difference in risk for AD dementia between AAs and Caucasians in logarithmic scale, as a function of baseline age for sixteen participant groups jointly defined by APOE ε4, sex, BMI, and education (Educ). A negative difference indicates lower AD risk in AAs relative to Caucasians, and a positive difference indicates higher risk in AAs. Red color indicates p values <0.05, green p values in 0.05~0.1, and blue p values >0.1, for testing the risk difference against 0.

