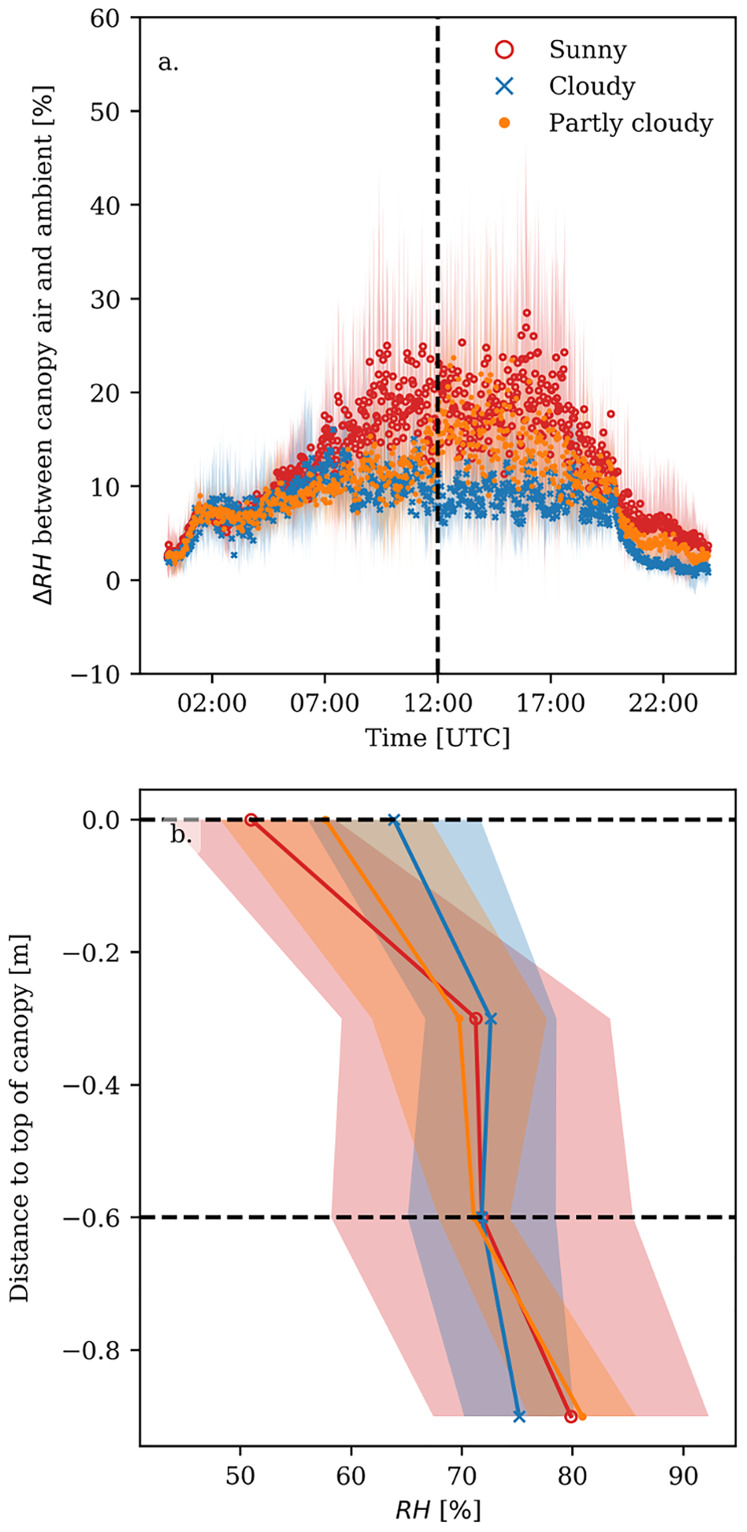
Fig 4. Difference between ambient relative humidity (RH) and canopy relative humidity (i.e. RH of the air 60 cm below the top of the canopy).
Bold lines represent the average value, whereas the shaded area represents the standard deviation over the days for sunny (red), cloudy (blue) and partly cloudy days (orange). (a) time course of the RH difference, where the dashed line indicates noon. (b) vertical RH profile in the canopy at noon; the dashed lines show the heights at which the differences between ambient and canopy RH were calculated.

