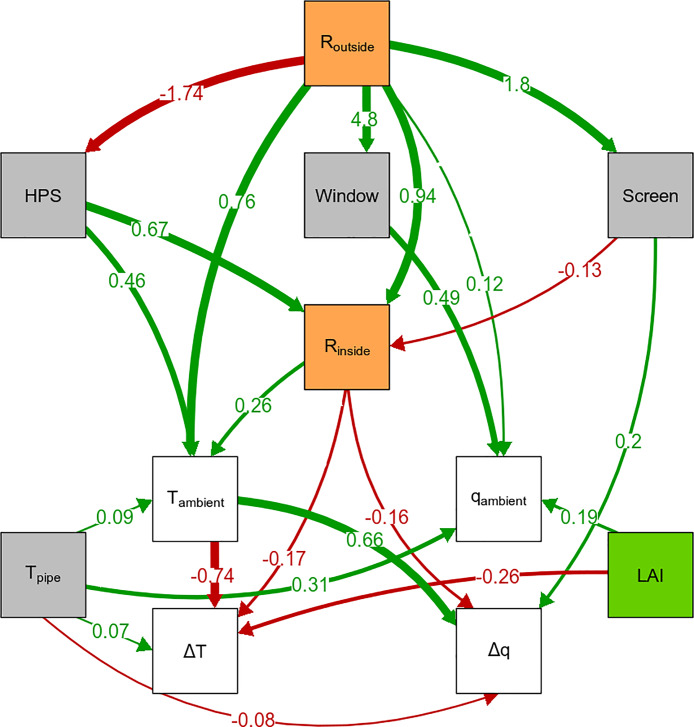
Fig 6. Causal path model for the difference between canopy air and ambient temperature (ΔT) and absolute humidity (Δq).
Causal path model that was consistent with the data (p = 0.058, df = 32, Fisher’s C = 45.47), where arrows show a causal relation and the values the standardised path coefficients. The standardised path coefficients measure the effect of one variable on another in standard deviation units. The colour of the boxes denote the following: white represents the climate variables, grey represents the climate control measures, green represents the crop and orange represents radiation. Paths with a standardised path coefficient below 0.07 have been removed for presentation purposes. For the complete diagram see S5 Fig. Abbreviations: Routside is outside global radiation; Rinside is inside global radiation; HPS is High Pressure Sodium lamps, supplemental assimilation lighting; Window is window opening (open or closed); Screen is shading screen position (open or closed); Tpipe is temperature of the heating pipe; LAI is leaf area index; Tambient is ambient temperature, temperature above canopy; qambient is ambient absolute humidity, absolute humidity above canopy; ΔT is difference between ambient temperature and air temperature in the canopy; Δq is difference between ambient absolute humidity and absolute humidity in the canopy. Also see Table 1.

