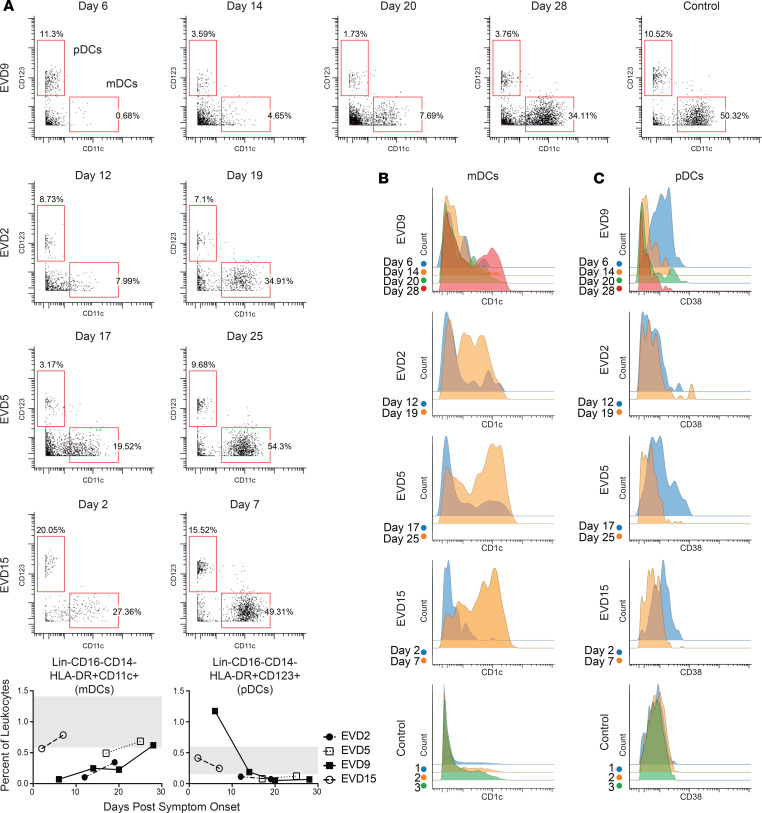
Figure 4. Perturbations in DC populations during EVD.
(A) mDCs are lost during the acute phase of disease but return in convalescence. Quantitation of these DCs as a percentage of CD45+CD66– leukocytes is shown in graphs (range for all controls in gray). (B) Coinciding with the return of mDCs in convalescence, CD1c expression on mDCs is dramatically upregulated. (C) pDCs have increased expression of CD38 during the acute-phase time points. Samples from a control obtained on 3 separate dates are shown for comparison for both B and C.

