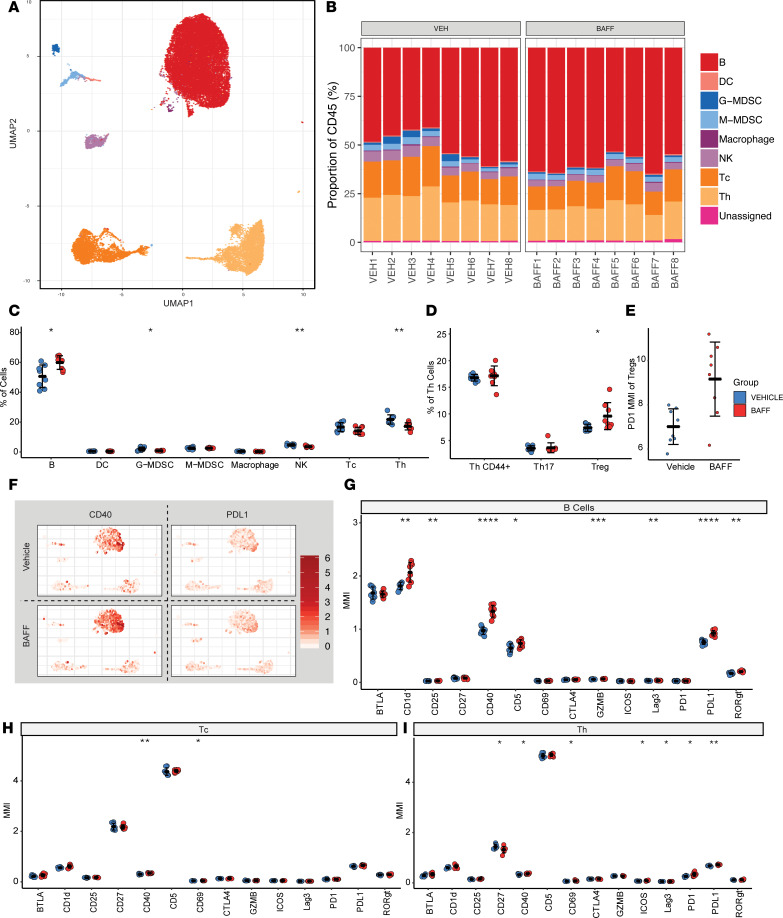
Figure 3. BAFF augments Th1 responses and promotes antitumor immunity, but also has distinct immunoregulatory functions.
(A) Uniform manifold approximation plot (UMAP), a dimensionality reduction technique to visualize similar cell proteomic characteristics in 2 dimensions, shows clustering results of 16 spleen samples (8 biological replicates for each of the 2 experimental arms) analyzed by mass cytometry. A total of 2000 events per sample is shown. Each color represents a specific immune cell type, as annotated based on marker intensity profiles. Color legend is shown with B. (B) Immune cell composition within each of the spleen samples are shown in stacked bar graphs as a percentage of CD45+ cells. (C) BAFF treatment increases the proportion of B cells in the spleen, while decreasing G-MDSC, NK, and Th cell populations. (D) Of the Th cell fraction, BAFF treatment increases the proportion of CD44+ cells, while decreasing the proportion of Tregs. (E) BAFF treatment increases the mean signal intensity of PD-1 in Tregs taken from the spleen. (F) Mass intensity heatmaps for each of the 2 immune markers, CD40 and PD-L1, are superimposed onto the UMAP representation of the cell clusters, as shown in A for the 2 experimental groups, vehicle- and BAFF-treated. (G) BAFF treatment affects B cells by increasing the proportion of B cells expressing CD1d, CD25, CD40, CD5, GZMB, Lag3, PD-L1, and RORγt (statistically significant changes). (H) BAFF treatment affects CD8+ cytotoxic T (Tc) cells by increasing the proportion of Tc cells expressing CD40 and CD69. (I) BAFF treatment affects Th cells by increasing the proportion of Th cells expressing CD40, CD69, ICOS, Lag3, PD-1, and PD-L1, while decreasing the proportion of cells expressing CD27. Two-tailed unpaired t tests were used to compare vehicle and BAFF groups; *P < 0.05, **P < 0.01, ***P < 0.001, ****P < 0.0001.

