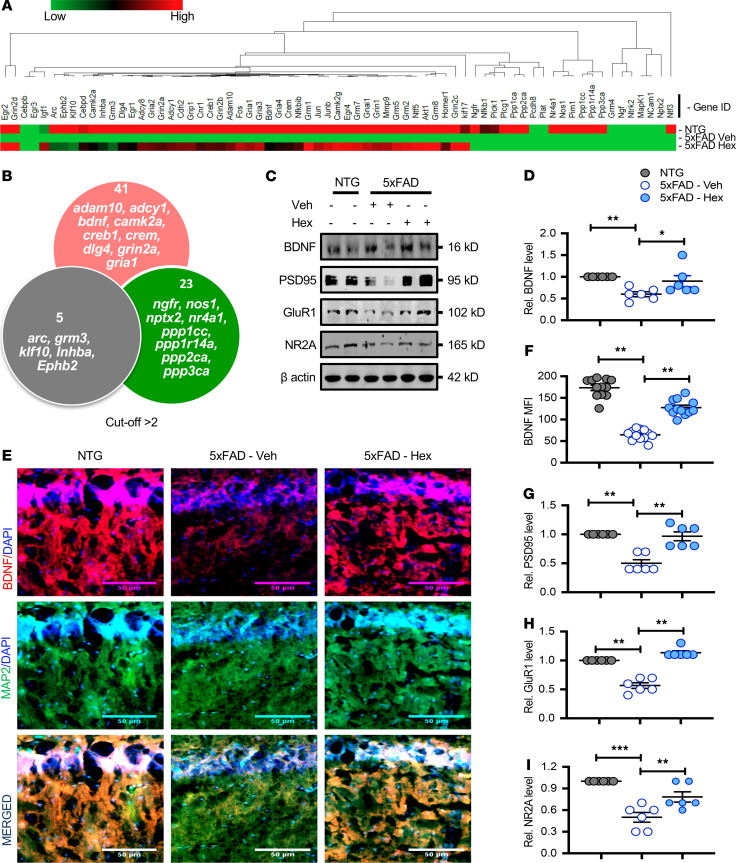
Figure 2. Hex upregulates BDNF and other hippocampal plasticity–associated proteins in the hippocampi of 5XFAD mice.
5XFAD mice (n = 6/group; 6–7 months old) were treated orally with Hex (5 mg/kg/d) or vehicle (0.1% methyl cellulose) for 1 month. Untreated non-Tg (NTG) mice (n = 6) were used as control. Following 1 month of Hex treatment, the mRNA expression of several plasticity-associated genes was analyzed by real-time PCR, followed by gene array analysis. GAPDH was used as an endogenous control. (A) Heatmap showing relative expression of differentially regulated plasticity genes in hippocampi of NTG or Hex-fed 5XFAD mice compared with that of vehicle-fed 5XFAD mice. (B) Venn diagram summarizing the numbers of differentially regulated plasticity genes. Relative expression greater than 2 was considered statistically significant. (C) Similarly, following 1 month of Hex treatment, protein levels in hippocampal homogenates of selected plasticity-associated molecules (BDNF, PSD95, GluR1, and NR2A) were analyzed by immunoblot analysis. β-Actin was used as a loading control. Uncropped Western blot images are shown in Supplemental Figure 6. Relative densities of BDNF (D), PSD95 (G), GLUR1 (H), and NR2A (I) immunoblots compared with that of β-actin were calculated by ImageJ. Results are shown as mean ± SEM. One-way ANOVA [BDNF protein, F(2,15) = 6.5000, P = 0.009; PSD95 protein, F(2,15) = 23.977, P < 0.001; GLUR1 protein, F(2,15) = 74.063, P < 0.001; NR2A protein, F(2,15) = 19.624, P < 0.001], followed by Bonferroni’s multiple comparisons test was used to assess significance of the mean; *P < 0.05 vs. vehicle-fed 5XFAD; **P < 0.01, ***P < 0.001 vs. vehicle-fed 5XFAD. Hippocampal sections were also double labeled for MAP2 (green) and BDNF (red) (E). Scale bars: 50 μm. (F) MFI of hippocampal BDNF was calculated using ImageJ. For quantification, 2 sections per mice (n = 6/group) were used. Results are shown as mean ± SEM. One-way ANOVA [BDNF MFI: F(2,33) = 115.77, P < 0.001] followed by Bonferroni’s multiple comparisons test was used to assess significance of the mean; **P < 0.01 vs. vehicle-fed 5XFAD.

