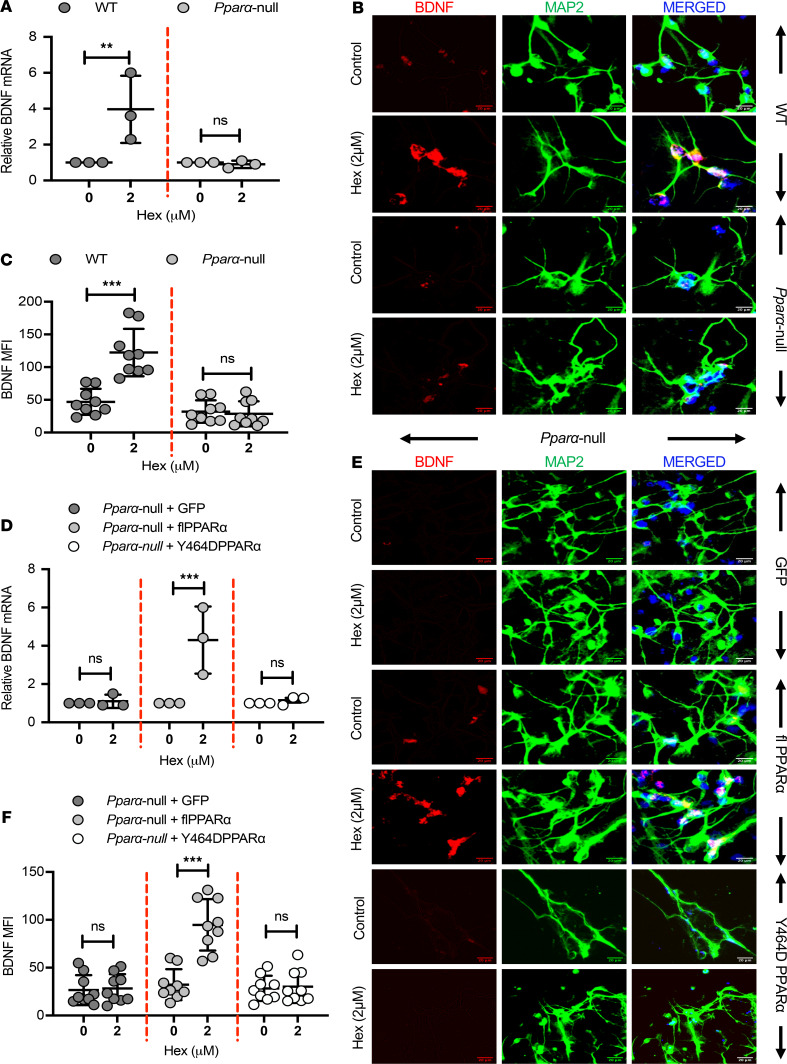
Figure 4. Hex upregulates BDNF in hippocampal neurons via PPARα.
(A) WT or Pparα-null hippocampal neurons were treated with Hex (2 μM) for 5 hours followed by Bdnf mRNA by real-time PCR. Results are mean ± SD of 3 independent experiments. Statistical analyses between groups were performed using 2-way ANOVA considering genotype [F(1,8) = 7.918, P = 0.02] and treatment [F(1,8) = 6.919, P = 0.03] as 2 independent variables. Interaction statistics between 2 independent variables was calculated as well [F(1,8) = 7.918, P = 0.02]. Bonferroni’s multiple comparisons test was applied to assess the significance of the mean; **P < 0.01 vs. control, nsP > 0.05 vs. control. (B) Cells were also treated with Hex for 12 hours and BDNF protein level was investigated by immunostaining. Scale bars: 20 μm. (C) MFI of hippocampal BDNF. Statistical analyses were performed using 2-way ANOVA considering genotype [F(1,32) = 44.55, P < 0.001] and treatment [F(1,32) = 19.53, P < 0.001] as 2 independent variables. Interaction statistics between 2 independent variables was calculated as well [F(1,32) = 23.54, P < 0.001]. Bonferroni’s multiple comparisons test was applied to assess the significance of the mean; ***P < 0.001 vs. control, nsP > 0.05 vs. control. (D) Pparα-null hippocampal neurons were transduced with either empty lentiviral vector (GFP) or with the lentiviral vector containing flPPARα or Y464DPPARα for 48 hours followed by stimulation with Hex. After 5 hours, cells were analyzed for Bdnf mRNA. Results are mean ± SD of 3 independent experiments. Statistical analyses of Bdnf mRNA expression analyses between groups were performed using 2-way ANOVA considering lentiviral treatment [F(2,12) = 9.318, P = 0.004] and Hex treatment [F(1,12) = 11.71, P = 0.005] as 2 independent variables. Interaction statistics between 2 independent variables was calculated [F(2,12) = 9.318, P = 0.004]. Bonferroni’s multiple comparisons test was applied to assess the significance of the mean; ***P < 0.001 vs. control, nsP > 0.05 vs. control. Similarly, BDNF protein was analyzed by immunofluorescence. (E) Representative images. Scale bars: 20 μm. (F) MFI of hippocampal BDNF. Statistical analyses of hippocampal BDNF between groups were performed using 2-way ANOVA considering lentiviral treatment [F(2,48) = 23.31, P < 0.001] and Hex treatment [F(1,48) = 20.53, P < 0.001] as 2 independent variables.

