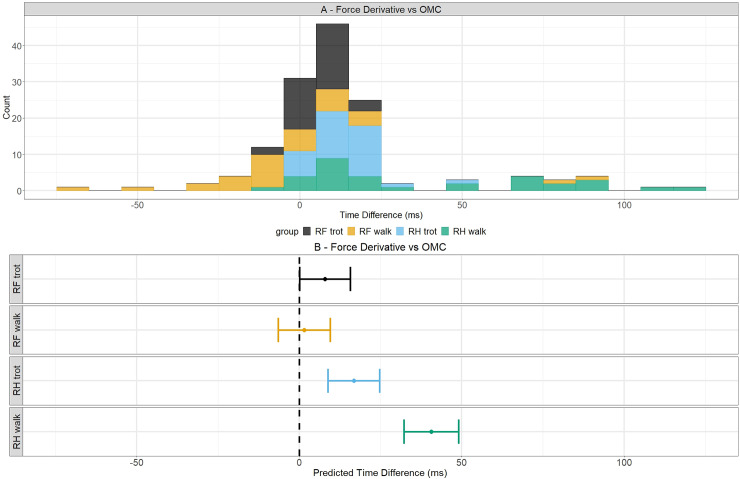
Fig 3. Time differences and predicted values of time differences between force derivative and OMC system for break-over phase onset detection.
Time differences between the two reference methods are depicted in the upper figure with the different hoof/gait combinations depicted in their own color. In the bottom, the predicted values are indicated with dots for a certain hoof/gait combination and their 95% confidence intervals are shown by the whiskers. The dashed line indicates a predicted time difference of 0 ms.

