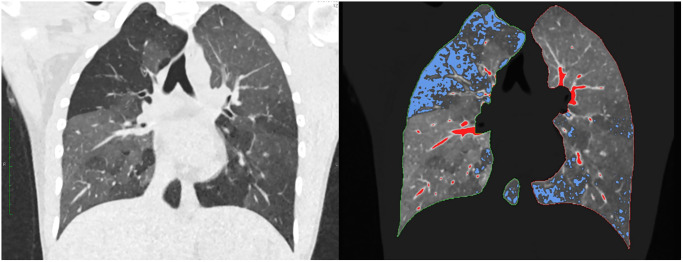
Fig 1. Lung quantification.
Coronary reformation; automatic detection of lung borders and lung parenchyma. blue areas: low attenuation volume (LAV) with HU values below -950, red areas: high attenuation volume (HAV) with HU values above -200. This patient was not included in the analysis but showcases the quantitative analysis in low attenuated areas.

