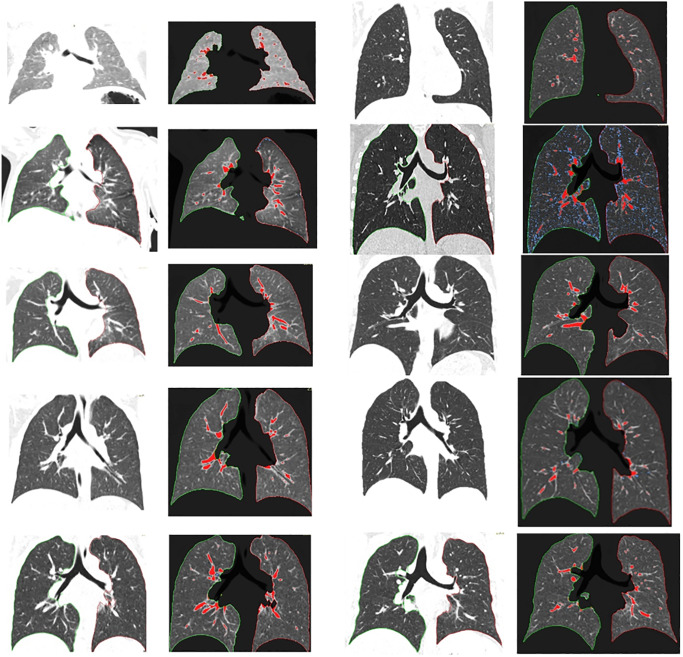
Fig 2. Parenchyma quantification from infancy to adulthood.
Reading direction: left top to bottom, right top to bottom. Age as following: 0, 3, 6, 9, 11, 15, 18, 21, 24, 27 years. Shown are exemplary lung parenchymas with (right images) and without (left images) quantification. Red dyed parenchyma shows HU values above -200, blue tissue below -950.

