Figure 1.

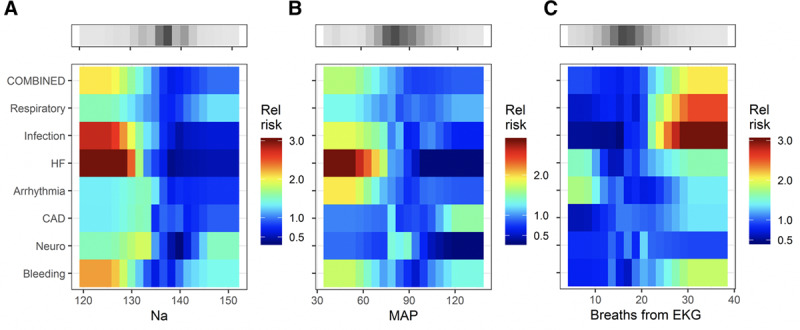
Heat maps that relate the relative risk (color bar; 1 means the risk is average for the ward) to the reason for ICU transfer (rows) and measured value of a predictor (abscissa) for a representative laboratory value (A, serum Na in meq/dL), vital sign (B, mean arterial pressure [MAP] in mm Hg), and cardiorespiratory measure from time series analysis of continuous cardiorespiratory monitoring (C, breaths per minute derived from the electrocardiogram [EKG]). The gray-scale bars show the density of the measurements. The figure may be interpreted as follows. The change in color from deep red to blue from left to right in the fourth row of (A) signifies that low serum Na concentration was associated with a high risk for ICU transfer for escalation of heart failure (HF) therapy. CAD = coronary artery disease, RCT = randomized control trial.
