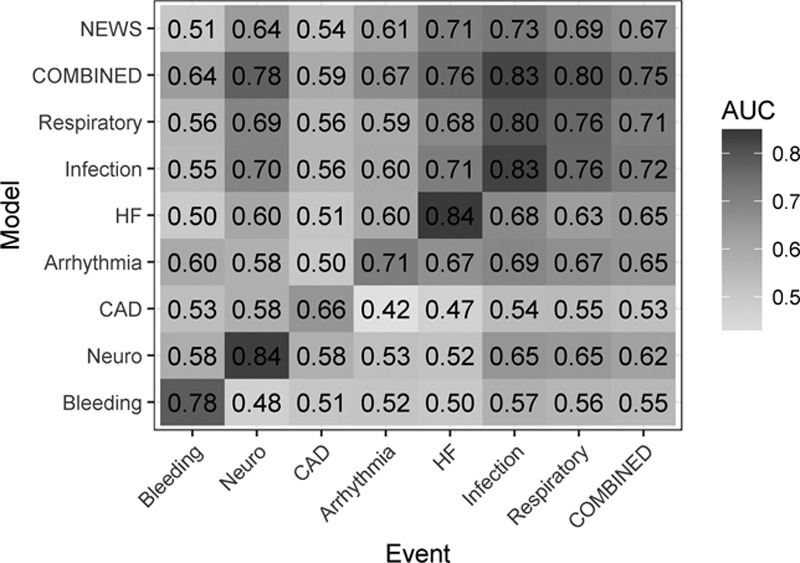
Figure 5.

Receiver operating characteristic (ROC) curve areas for models trained for the events listed in rows, and tested for events arranged as columns. The top row is the performance of the National Early Warning Score (NEWS); the next to top row and the final column represent results of a model trained on all the ICU transfer events combined. The gray scale reflects the value of the ROC area. AUC = area under the curve, CAD = coronary artery disease, HF = heart failure.
