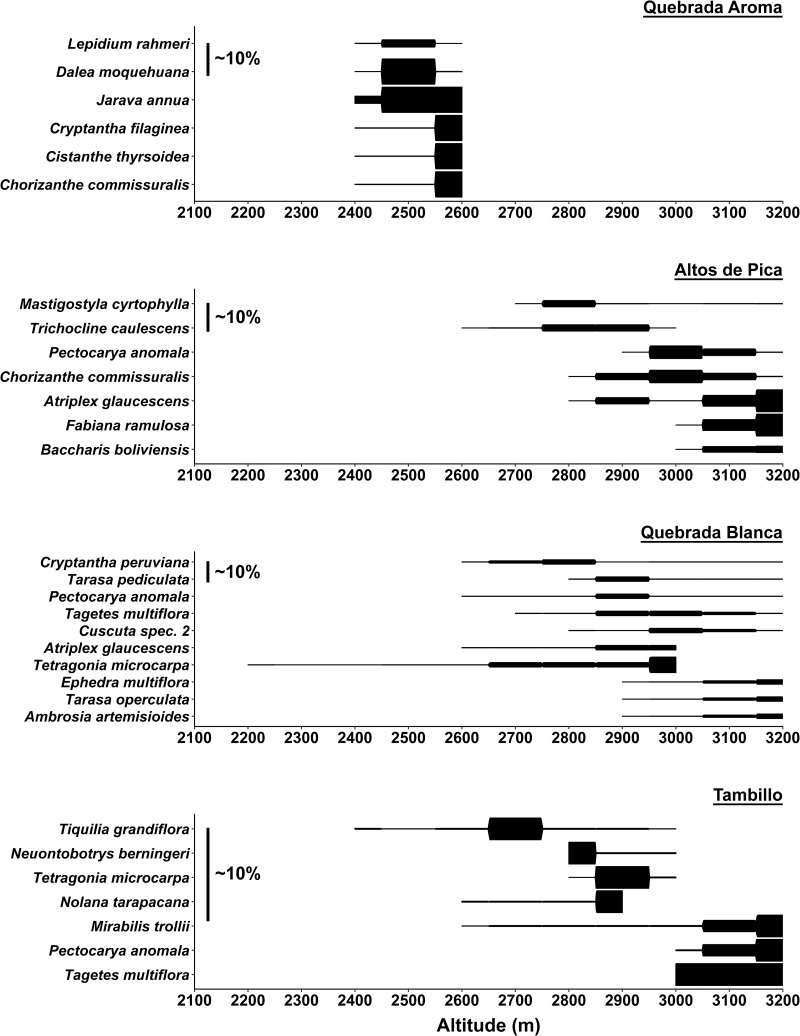
Fig 4. Abundance profiles of most dominant species along the four studied transects.
Abundance profiles are based on average cover values given in percentage (%) according to Tüxen and Ellenberg [39, 40]. Most dominant species were selected by highest cover values. For each transect scalebars indicate average plant cover of about 10%.

