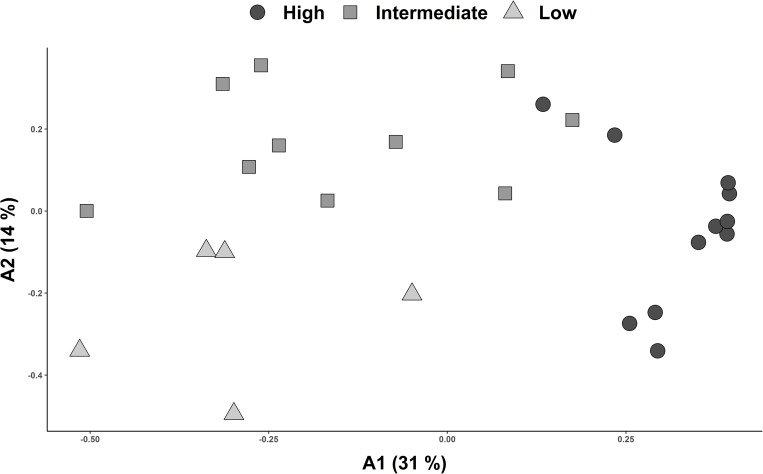
Fig 6. Ordination analysis of pairwise floristic similarity (Sørensen index) including plots from all four studied transects.
Plots are assigned to altitudinal vegetation zones (A, B, C) retrieved from cluster analysis (Fig 4). X-and y-axis correspond to the first two axes resulting from Principal Coordinates Analysis (PCoA).

