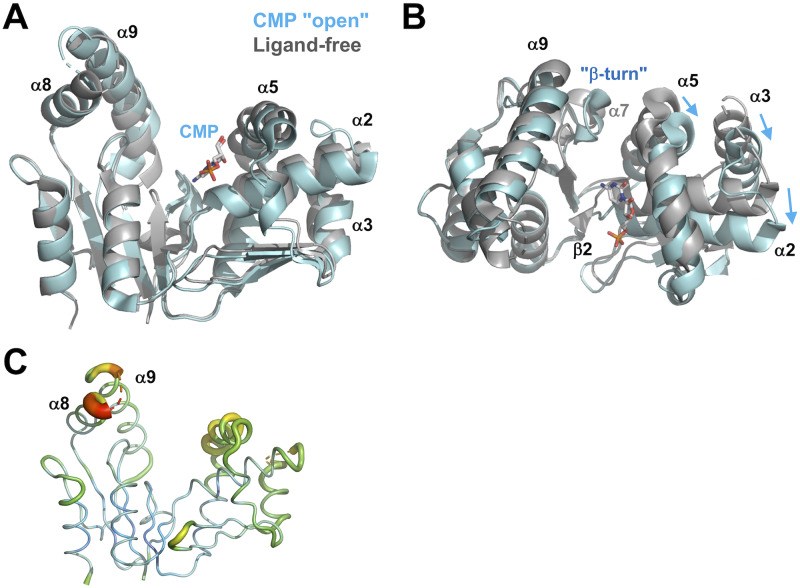
Fig 3. Superimposition of the structures of the ligand-free form (gray) and the CMP "open" complex (cyan).
(A) The two structures are superimposed on the basis of Cα positions in the CORE domain. CMP is shown as sticks colored according to atom type. Disordered regions are shown as dotted lines. (B) Compared to (A), this figure is rotated by 90° around the horizontal axis. (C) B-factor diagram of the ligand-free form represented by the B-factor putty program in PyMOL. The B-factor values are illustrated by color, ranging from low (blue) to high (red). The average B factor is 21.5 Å2.

