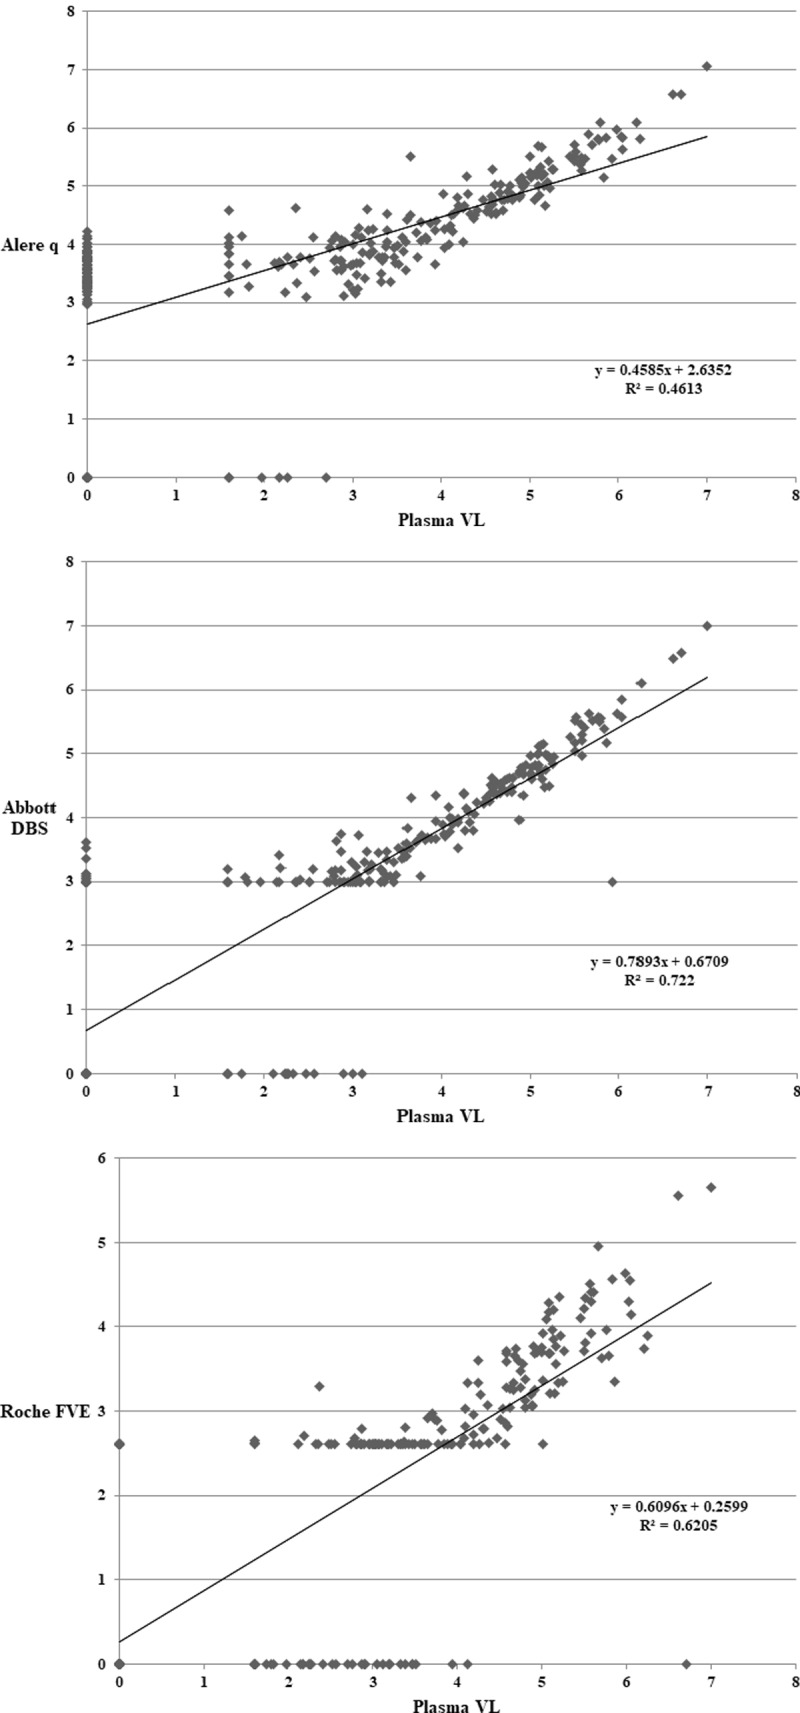
Fig 1. Correlation plots between plasma VL and Alere q/DBS assays in log10 copies/ml.

Correlation plots between plasma VL and 1a) Alere q—R2 = 0.46. 1b) Abbott DBS–R2 = 0.72. 2.9log10 has been used on plot for samples <1000 copies/ml (lower limit of quantification). 1c) Roche FVE—R2 = 0.62. 2.6log10 has been used on plot for Roche FVE samples <400 copies/ml (lower limit of quantification). Results below the detectable limit are plotted as 0 for all the plots.
