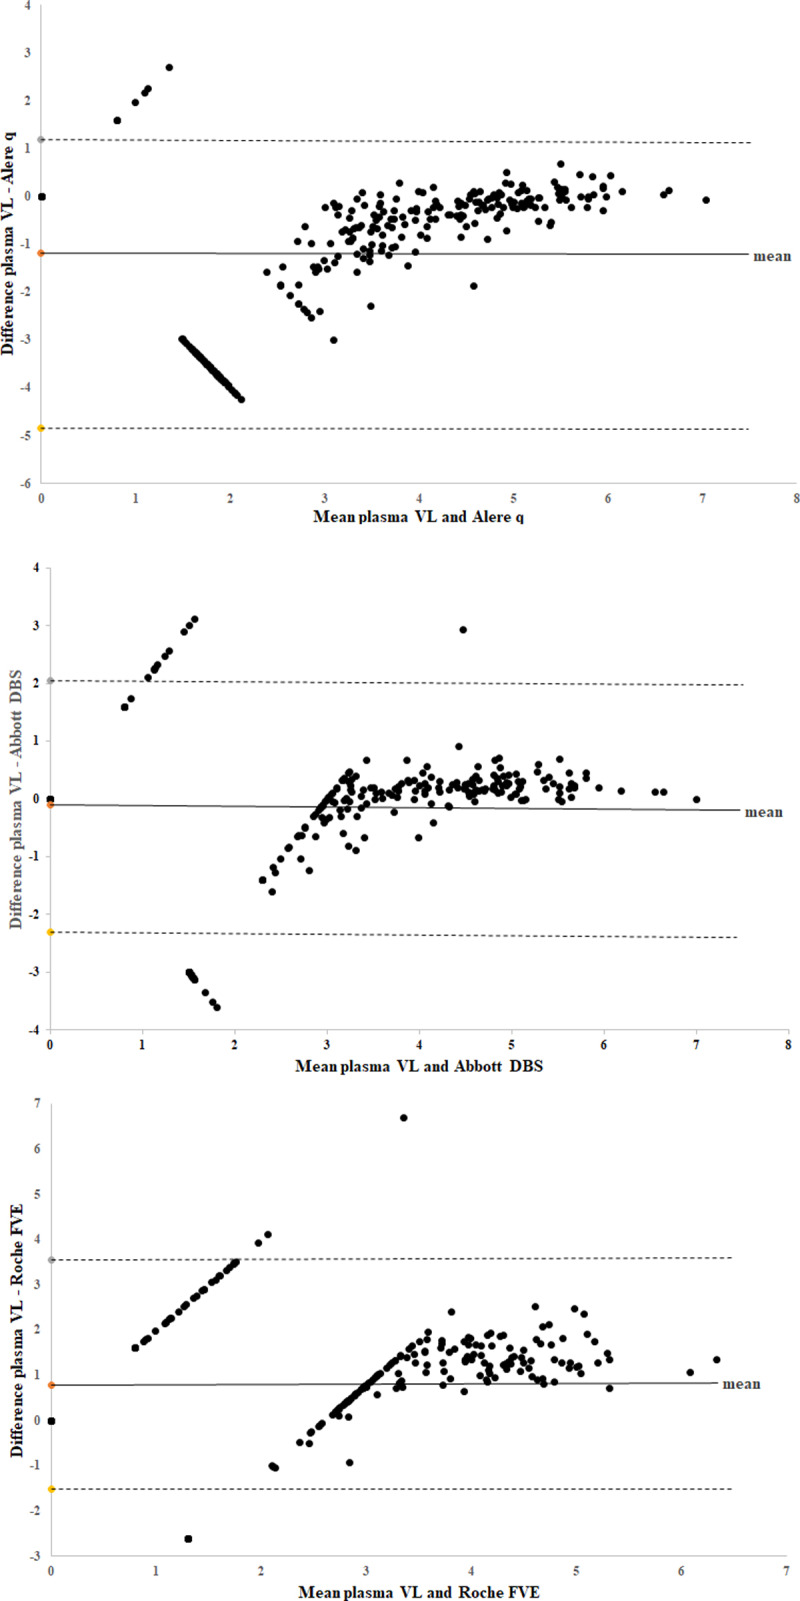
Fig 2. Bland Altman plots between plasma VL and Alere q/DBS assays in log10 copies/ml.

Overall mean log10 copies/ml difference between plasma VL and 2a) Alere q = -1.18 2b) Abbott DBS = -0.11 2c) Roche FVE = 0.78. Viral load that was below the detectable limit was plotted as 0 on graph, <1000 copies/ml for Abbott DBS was plotted as 2.9 log10, and <400 copies/ml for Roche FVE was plotted as 2.6 log10. The horizontal lines represent the mean (solid line) and the ± 1.96 standard deviations (dashed lines).
