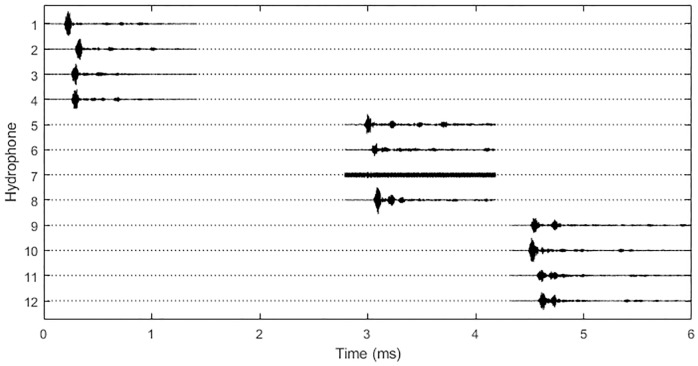
Fig 4. A typical harbour porpoise click detected on all three hydrophone clusters.
Dotted lines show the regions where no data are recorded for each channel and solid lines show the short sections of stored waveform. Small time delays between signal arrivals within each hydrophone cluster and larger delays between signal arrivals on the different clusters are clearly visible (hydrophone 7 is not working). This group of sounds was localised to a position approximately 15m E and 9m N of the array centre.

