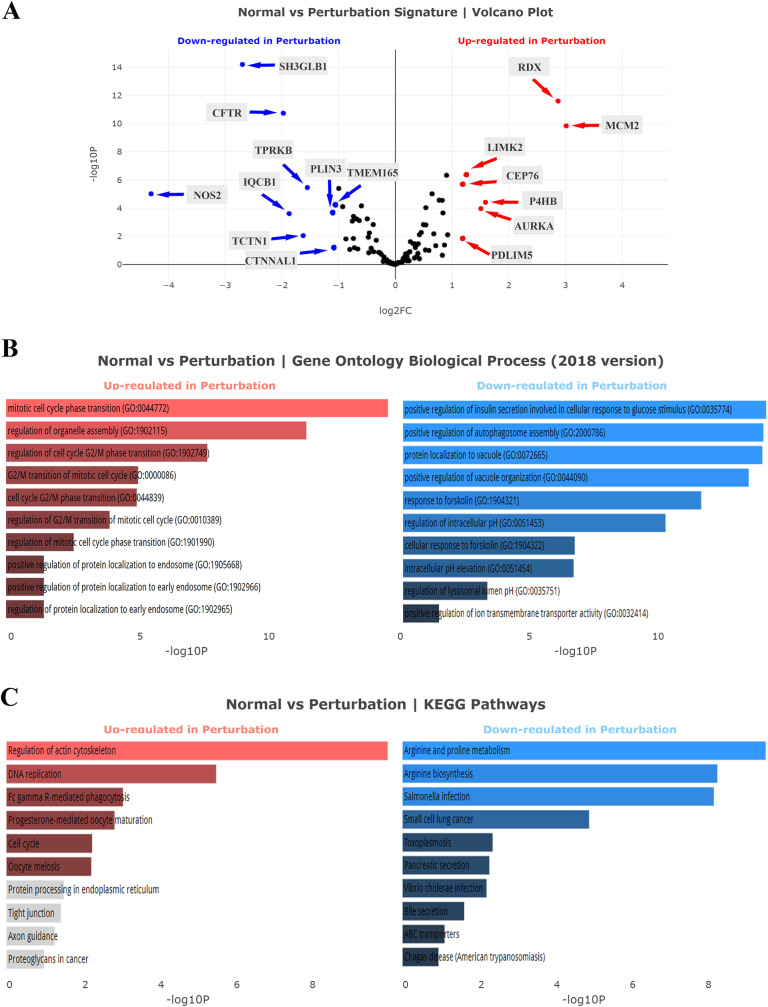
Fig 3. Analysis of calumenin correlated genes in TCGA-LUAD.
(A) Volcano plot analysis of the TCGA-LUAD dataset. (B) Gene Ontology (GO) biological process analysis. (C) KEGG pathways analysis. The statistical significance of each gene was calculated using the Cuffdiff package and demonstrated as log2-fold changes in the volcano plot. Red points mean significantly upregulated genes, and blue points mean downregulated genes.

