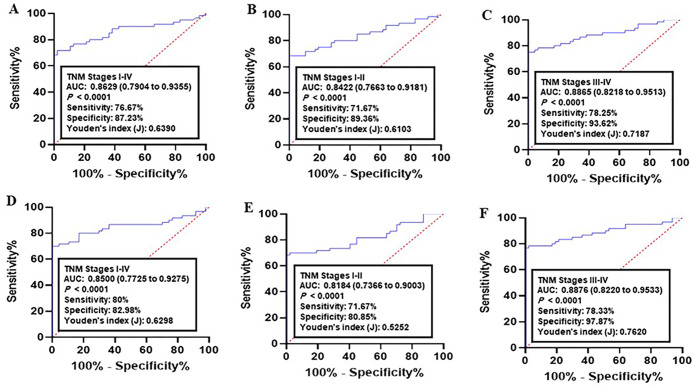
Fig 5. Receiver operating characteristics (ROC) curve analysis of the logit model with the CALU/AURKA/MCM2 panel.
(A-C) The area under the ROC curve (AUC) assessment of the logit(p) value for the CALU/AURKA/MCM2 panel in distinguishing (A) lung cancer patients (All TNM stages), (B) early lung cancer (I-II TNM stages), and (C) advanced lung cancer (III-IV TNM stages) from the healthy controls in training set. (D-F) The area under the ROC curve (AUC) assessment of the logit(p) value for the CALU/AURKA/MCM2 panel in distinguishing (D) lung cancer cases (All TNM stages), (E) early lung cancer (I-II TNM stages), and (F) advanced lung cancer (III-IV TNM stages) from the healthy controls in validation set. Logit(p) = 14.1828–0.1955 X (CALU)– 0.1811 X (AURKA)– 0.1857 X (MCM2).

