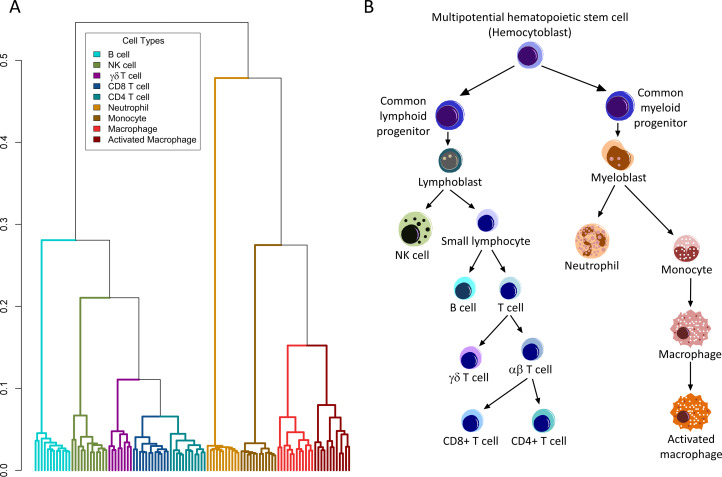
Fig 2. Unsupervised hierarchical clustering of RNA-seq data reflects hematopoietic differentiation.
A dendrogram representation of the unsupervised hierarchical clustering of RNA-seq data from across all individuals and cell types (Panel A) has a structure that closely resembles the known differentiation scheme of immune cells (Panel B). Each dendrogram leaf represents a single RNA-seq sample and Y-axis represents the distance based on Pearson correlation. Black arrows represent a decision in the known differentiation scheme of immune cells.

