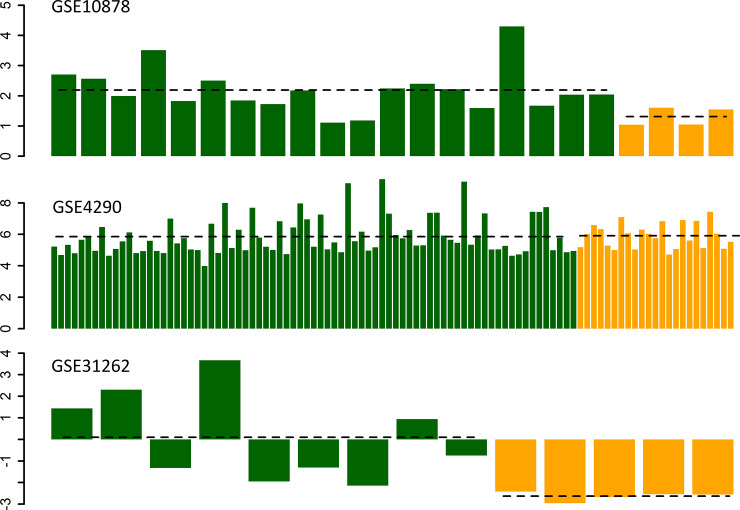
Fig 1. Gene expression of IDO1 in glioblastoma tissue (green) as compared to non-tumor tissue (yellow) with data analyzed from publicly available datasets.
Group average expression in the glioblastoma groups and the control groups respectively is represented with the horizontal, dashed black line. On the y-axis log2-transformed fold change is represented, and on the x-axes the expression of IDO1 in the individual samples analyzed is presented. In the GSE4290 data set the Affymetrix Human Genome U133 Plus 2.0 Array platform was used to investigate global gene expression levels in 23 non-tumor brain samples and 77 samples from patients with glioblastoma. In the GSE10878 data set the Agilent-013282 Human Genome CGH Microarray 44B platform was used to compare gene expression in 4 non-tumor samples and 19 samples from patients with glioblastoma. In the GSE31262 data set the ABI Human Genome Survey Microarray Version 2 platform was used to compare gene expression between 5 individual samples of adult neural stem cells and 9 individual samples of glioma stem cells.

