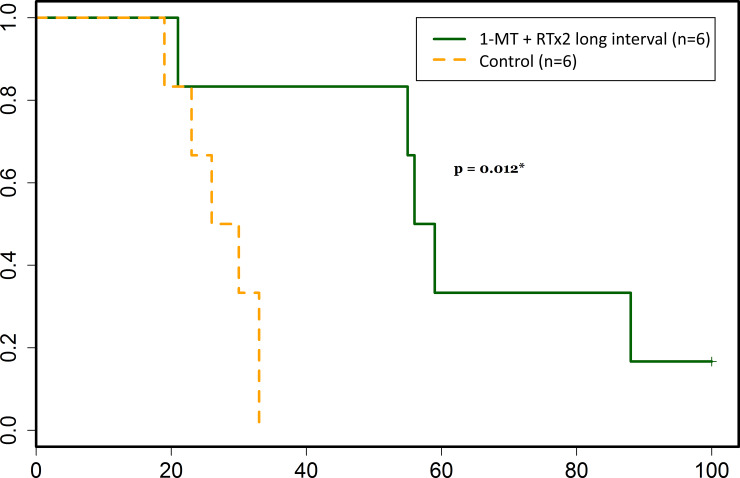
Fig 7. Survival was significantly increased in animals treated with 1-MT + RT x 2 (7 days between the two fractions) as compared to control animals (p = 0.012), which is demonstrated in the Kaplan-Meier curve presented here.
Survival in days after tumor cell inoculation is represented on the x-axis, and the proportion of animals still alive is represented on the y-axis.

