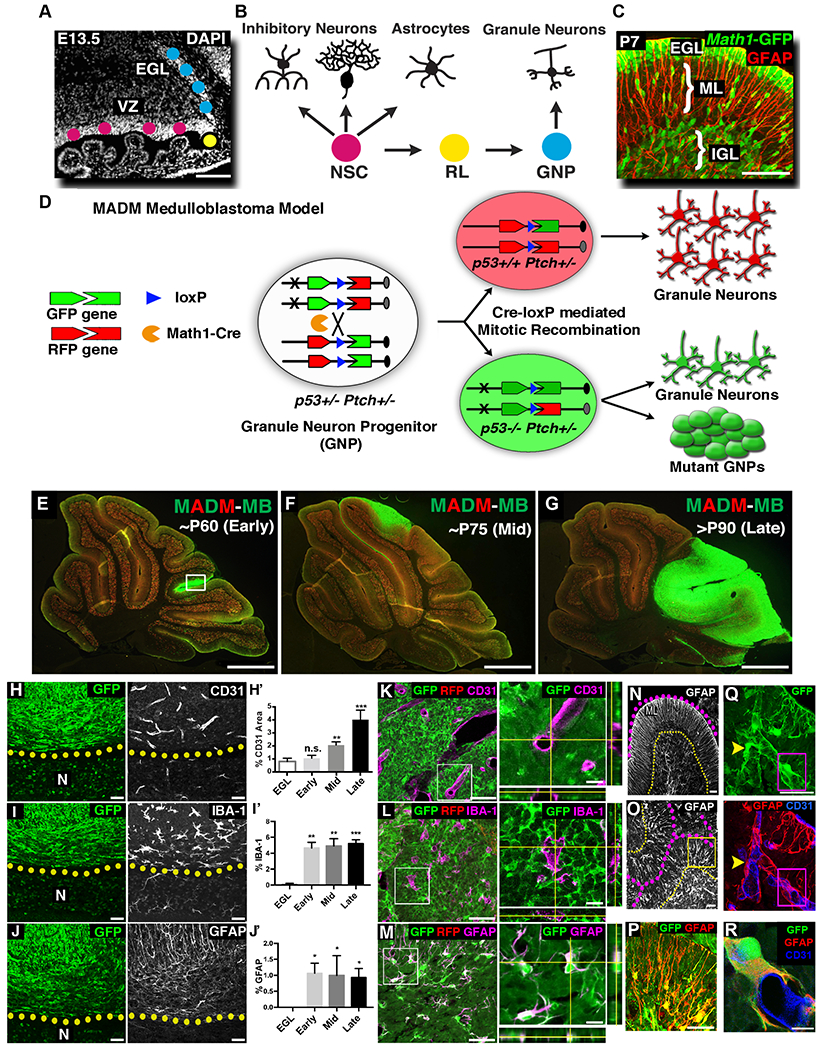
Figure 1. MADM-based medulloblastoma model reveals that some tumor GNPs trans-differentiate into astrocytes.

A-B, The cerebellum develops from two physically separated progenitor pools: multipotent NSCs in the ventricular zone (VZ) and unipotent GNPs in the external granule layer (EGL). C, At neonatal age, GNPs (Math1-GFP+) proliferate exponentially in the EGL, then migrate along radial processes of Bergmann glia (GFAP+) in the molecular layer (ML) into the inner granule layer (IGL) and terminally differentiated into mature granule neurons. D, MADM-based medulloblastoma model that generates RFP+, p53+/+ and GFP+, p53−/− GNPs in Ptch1+/− mouse. E-G, MADM-based medulloblastoma model had relatively consistent tumor progression kinetics. H,H’, Tumor-associated vessels had larger lumen sizes than adjacent normal tissue (N). Compared to normal EGL, blood vessel coverage gradually increased as tumors progressed (n=3, 4, 4 and 3, respectively). I,I’, Microglia are few in the EGL, but significantly increase during tumor progression (n=3 each). J,J’ Astrocyte cell bodies are absent in EGL but are significantly present in the tumor mass (n=3 each). K-M, Blood vessels (K) and microglia (L) did not express GFP. In stark contrast, all GFAP+ cells within the tumor mass (M) were GFP+ (see also Supplemental video). N, In the normal cerebellum, GFAP+ Bergmann glia extend radial processes through ML (outlined with dotted lines). O, Similar radial organization of GFAP+ processes could be found in focal areas in the tumor mass (outlined with dotted lines). P, Higher magnification of the boxed region in O. Q,R, Tumor-derived astrocytes (GFP/GFAP+) intimately interacted with blood vessels (CD31+), often wrapping an entire vessel (R, higher magnification of the boxed region in Q).
Scale bars: A=100μm, C= 50μm, E-G= 500μm, H-J, K-M (left panels), N-P= 50μm, K-M (right panels) and Q, R= 10μm.
Data are Mean±SD, one-way ANOVA; n.s. not significant, *p<0.05; **p<0.01; ***p<0.001.
See also Figure S1
