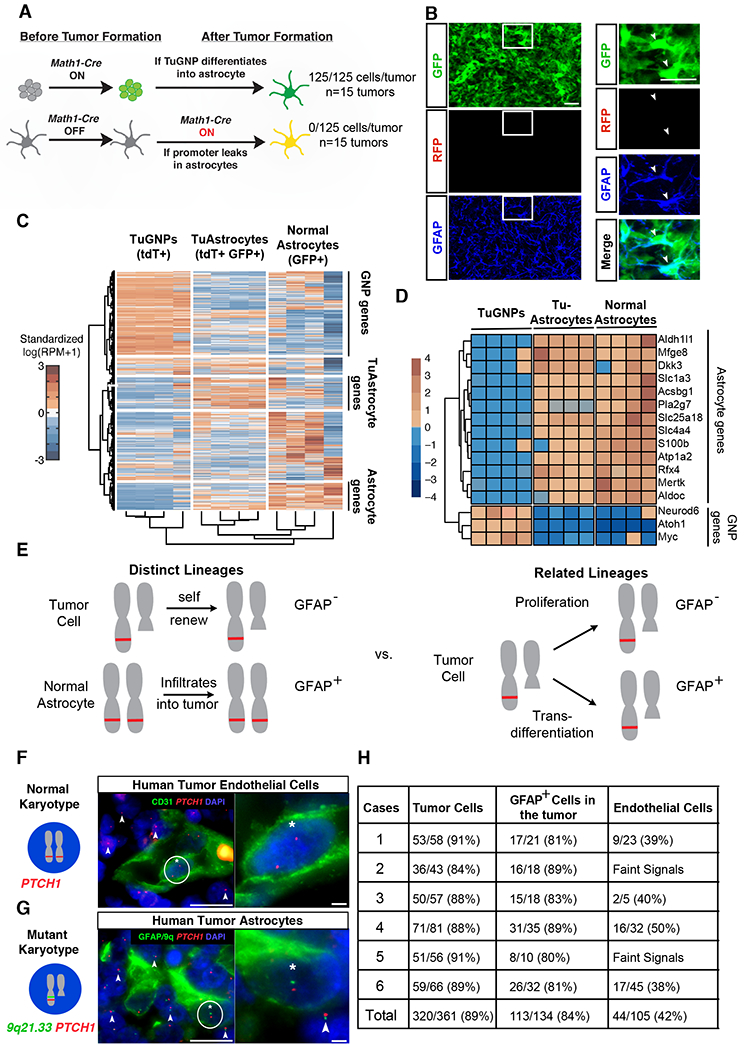
Figure 2. Validation of tumor-to-astrocyte trans-differentiation.

A, Schematic explanation on how the MADM system could definitively rule out the “Cre leakage” interpretation. B-B’ Representative images from the MADM model show that GFAP+ cells are not yellow. C, Hierarchical clustering of RNA sequencing data for TuGNPs, normal astrocytes, and TuAstrocytes. D, Many astrocytic markers are elevated in TuAstrocyte, while signature TuGNP genes are decreased in TuAstrocytes. E, Schematic illustration on how karyotypic analysis of astrocytes in human medulloblastoma could reveal their lineage relationship with tumor cells. F, Endothelial cells (CD31+) have a normal karyotype (two red FISH signals, asterisk-marked cell has zoom-in on the right), while surrounding tumor cells have one red signal (arrowheads), indicating the loss of one PTCH1-containing chromosomal fragment. G, The loss of one allele from the 9q21.33 region to the PTCH1 locus was seen in GFAP+ cells (asterisk-marked cell has zoom-in on the right), same as surrounding tumor cells (arrowheads). H, Quantification showed that the majority of TuGNP and TuAstrocytes in all six patient samples share the same karyotypic aberration.
Scale bars: B and B’=20μm, F and G (left panel) =25μm, F and G (right panel) =10μm
See also Figure S2
