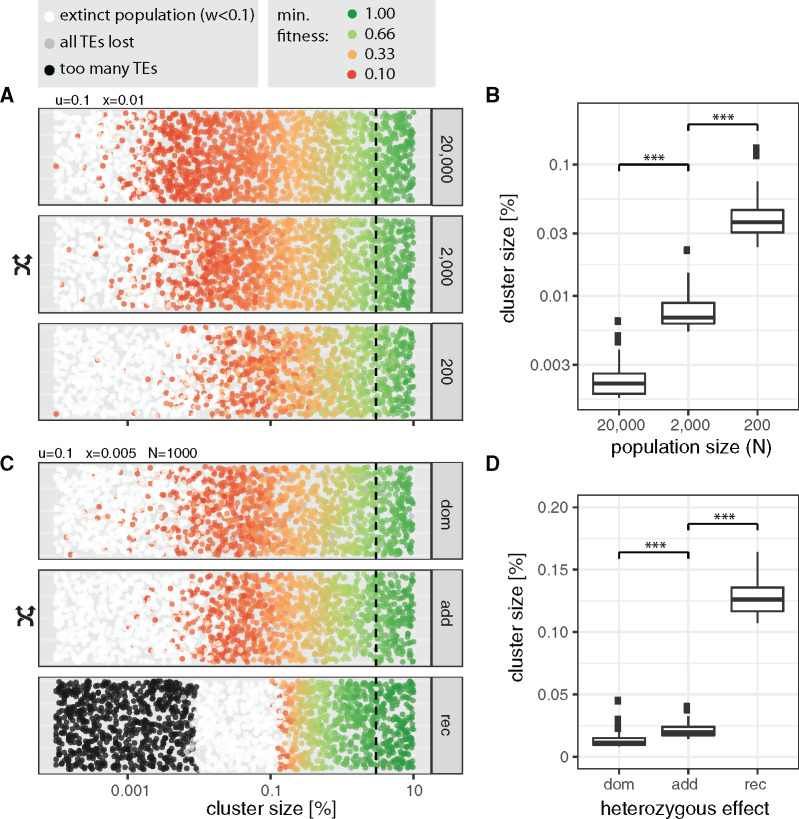
Fig. 5.
—Influence of the population size (A, B) and the heterozygous effect (C, D) on the minimum size of piRNA clusters. (A, C) Each dot represents the outcome of a single simulation with randomly chosen cluster sizes, population sizes (), or heterozygous effects of TEs (dom dominant, add additive, rec recessive). Dashed lines indicate the size of piRNA clusters in Drosophila melanogaster (3%). Random numbers are used for the y-axis. (B, D) The 50 largest clusters of extinct populations. Significance was estimated with Wilcoxon rank-sum tests. *** P < 0.001.

