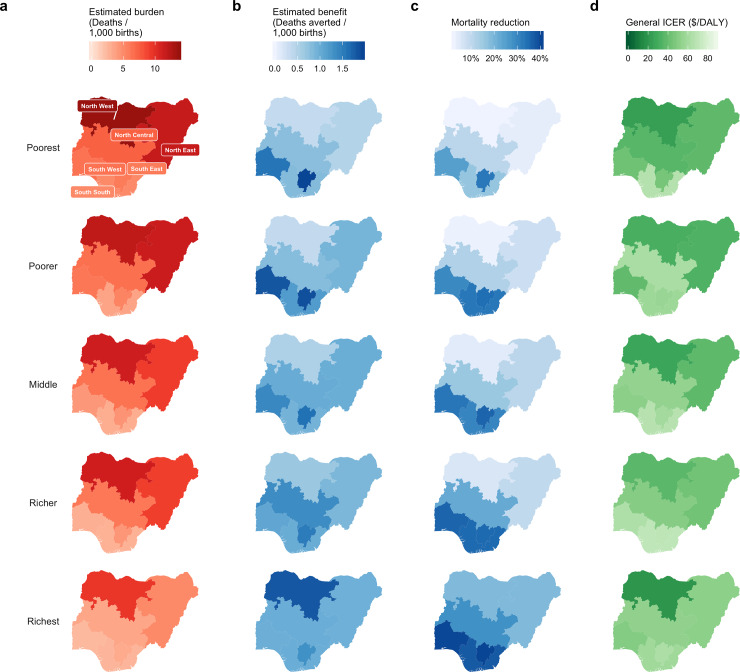
Fig 1. Estimated impact and cost-effectiveness of rotavirus vaccination by region and wealth quintile.
Mortality burden (deaths, a) and benefit (deaths averted, b) are expressed as rates per 1000 births over the first five years of life. Benefit is also expressed as mortality reduction (c) which is the percentage of burden prevented by vaccination. Incremental cost-effectiveness ratios (ICERs) are displayed in green (d).

