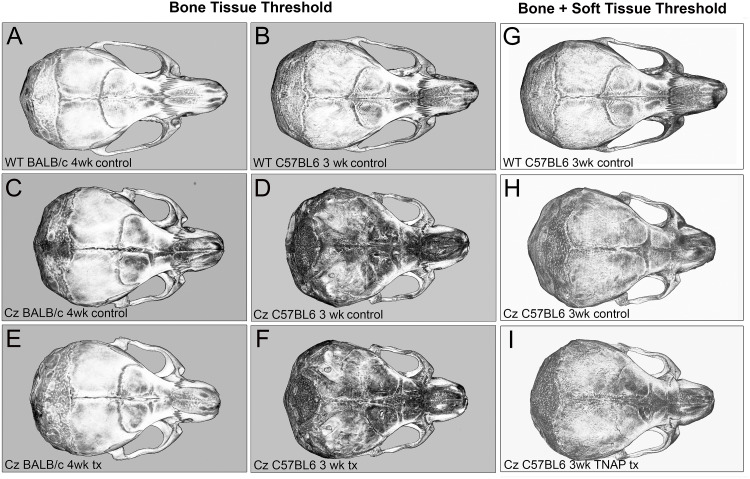
Fig 3. Isosurface micro CT images of control and TNAP treated FGFR2C342Y/+ mice.
Micro CT isosurface axial images of representative day 28 BALB/c and day 21 C57BL/6 mouse skulls are shown. Denser bone tissues are lighter in color. Control indicates no lentiviral delivery of TNAP. Tx indicates lentiviral delivery of TNAP. Comparison of BALB/c FGFR2+/+ (WT) mice (A), BALB/c FGFR2C342Y/+ (CZ) vehicle treated mice (C), and BALB/c FGFR2C342Y/+ (CZ) TNAP treated mice (E) indicates morphologic differences between genotypes but not treatment groups. Comparison of C57BL/6 FGFR2+/+ (WT) mice (B), C57BL/6 /c FGFR2C342Y/+ (CZ) control mice (D), and C57BL/6 FGFR2C342Y/+ (CZ) TNAP treated mice (F) indicates morphologic differences between genotypes but not treatment groups. (A-F) Isosurface images taken at a bone threshold. Skull images of control (D) and TNAP treated (F) C57BL/6 FGFR2C342Y/+ mice show both cranial vault and underlying cranial base due translucent poorly mineralized cranial bones in these mice. (G-I) Isosurface images taken at a threshold that includes both bone and soft tissue are provided for C57BL/6 FGFR2+/+ (WT) mice (G), C57BL/6 FGFR2C342Y/+ control mice (H), and C57BL/6 FGFR2C342Y/+ TNAP treated mice (I) are provided for improved visualization of these skulls.

