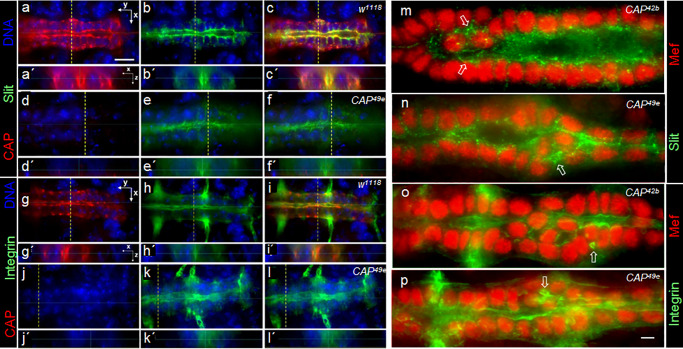
Fig 5. CAP is required for establishment of a distinct luminal boundary.
Optical sections of the heart region of stage 16 whole mount embryos stained for CAP (red) and Slit (green) in (a-f) or CAP (red) and ßPS1-Integrin (green) in (g-l); DNA in blue. (a-c) w1118 control: CAP colocalizes with Slit at a clearly defined luminal boundary. (a´-c´) shows the heart lumen in Z-sections taken at the dashed lines in corresponding XY images. (d-f) CAP49e: The lumen is much smaller, with an ill-defined Slit stained boundary. (e´, f´) In Z-sections a lumen is hardly detectable. (g-i) w1118: CAP colocalizes with ßPS1-Integrin at the abluminal side and at a clearly defined luminal boundary. (j-l) CAP49e: The ßPS1-Integrin stained boundary towards the lumen looks ill defined. (k´, l´) A lumen is hardly detectable in Z-sections. anterior left; bar in (a): 10 μm. (m-p) Optical sections of the heart region stained by (m, n) Mef2 (red) and Slit antibodies (green) or (o, p) Mef2 (red) and ßPS1-Integrin antibodies (green). (m) CAP42b; note the ill-defined, granular Slit staining at the luminal cell boundary. On both sides of the central CBs minilumina are formed (arrows). (n) CAP49e: in the region of central CBs, Slit extensively spreads and encircles minilumina (arrow). (o) CAP42b: in the region of central CBs, the formation of a continuous lumen is obscured and ßPS1-Integrin is detected in extra luminal and miniluminal boundaries (arrow). (p) CAP49e: ill-defined ßPS1-Integrin distribution similar to (o); extra lumina form between peripheral and central CBs (arrow); bar in (p): 5 μm.

