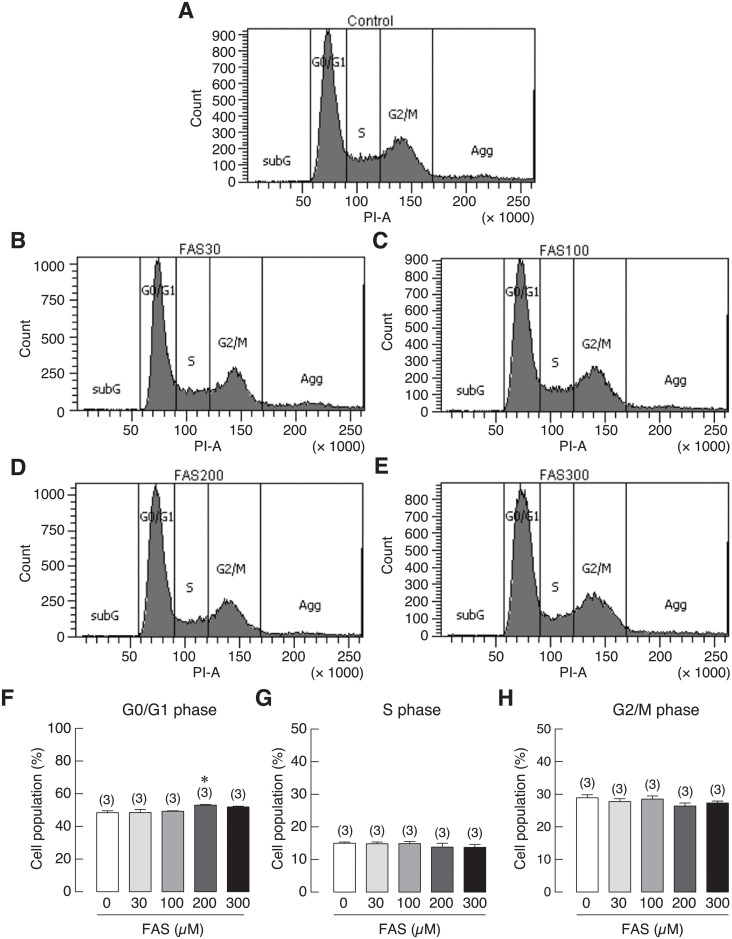
Fig 10. Cell cycle distribution of UMR-106 cells treated with 30, 100, 200 or 300 μM FAS.
(A–E) Representative figures of cell cycle distribution as determined by flow cytometry. Quantified data showing percent cell distribution in G0/G1 phases (F), S phase (G) and G2/M phases (H). *P < 0.05 as compared to control group (0 μM); PI, propidium iodide.

