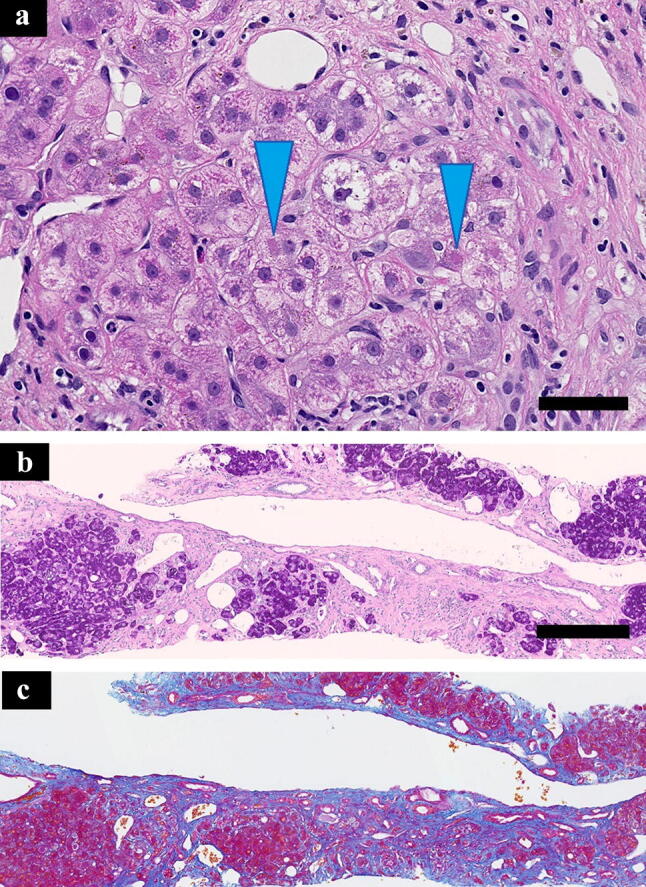
Fig. 3.

Pathological findings of liver biopsy. a (hematoxylin and eosin stain, scale bar: 50 μm): hematoxylin and eosin stain shows hepatocellular ballooning and Mallory bodies (blue arrowhead). b (periodic acid-Schiff stain, scale bar: 250 μm), c (Azan stain, scale: same as b): periodic acid-Schiff stain and Azan stain show lobular distortion with scattered small hepatic cell nests. Note that fatty change of hepatocyte is minimal
