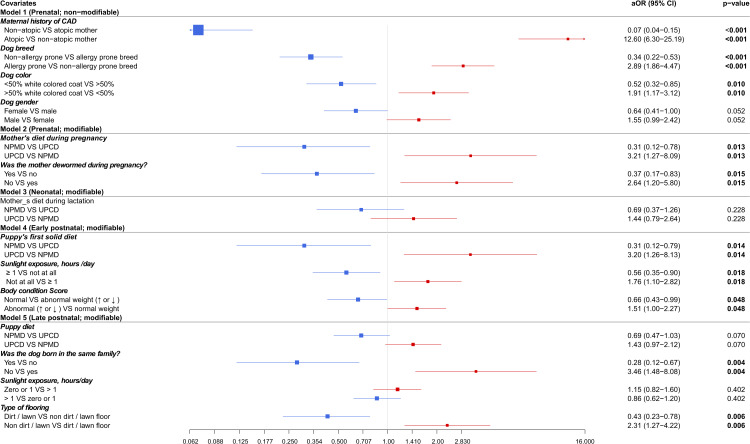
Fig 4. Forest plot of odds ratios for associations between pre-, neo-, early post- and late postnatal period variables and canine atopic dermatitis based on multivariable logistic regression analyses (n = 2236).
Included/missing dogs for each model: model 1 (789/1447), model 2 (1357/879), model 3 (1297/939), model 4 (782/1454) and model 5 (1071/1165). Models 2–4 have been adjusted for dog gender. aOR: adjusted odds ratio, CI: confidence interval, CAD: canine atopic dermatitis, bolded: P ≤ 0.05, NPMD: non-processed meat based diet, UPCD: ultra-processed carbohydrate based diet, VS: versus.

