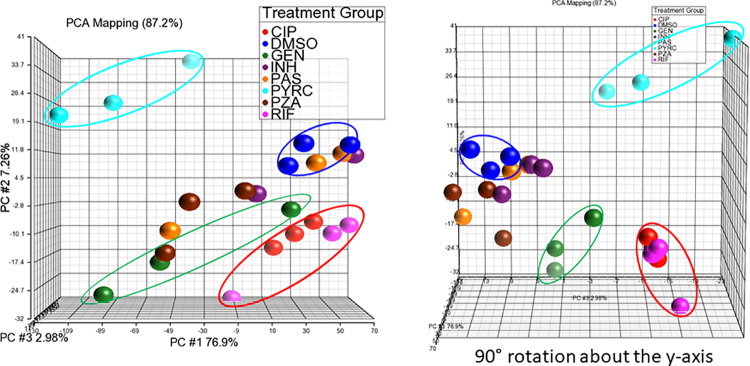
Fig 3. PCA of transcriptomic responses of Mtb cultures to anti-TB drug treatments.
Mtb cultures were treated in triplicate with ciproflaxin (red), DMSO (blue), gentamicin (green), isoniazid (purple), para-aminosalicylic acid (yellow), PYRC (cyan), pyrazindamide (brown), or rifampicin (magenta) for 6 hours at 10X IC90 or IC90. Vehicle (DMSO) cluster (circled in blue); transcription synthesis inhibitor cluster (circled in red); protein synthesis inhibitor cluster (circled in green); and PYRC cluster (circled in cyan). RNA-seq was performed and data analysis was completed in Partek®Genomic Suite®.

