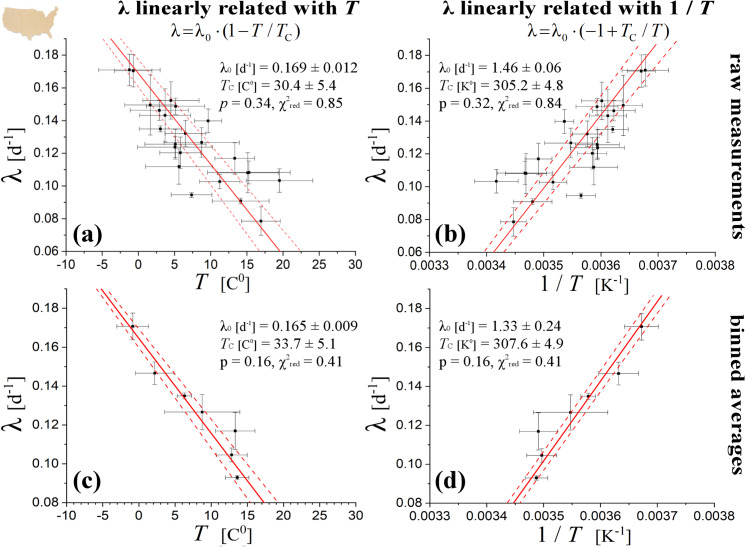
Fig 5.
Linear fitting of rates with (left) temperatures and (right) inverse temperatures for US regions. The fitting is weighted with double uncertainties (i.e., on both the temperature and rate values). The analysis is first completed for the raw measurements (upper) and then repeated for the binned averages (lower).

