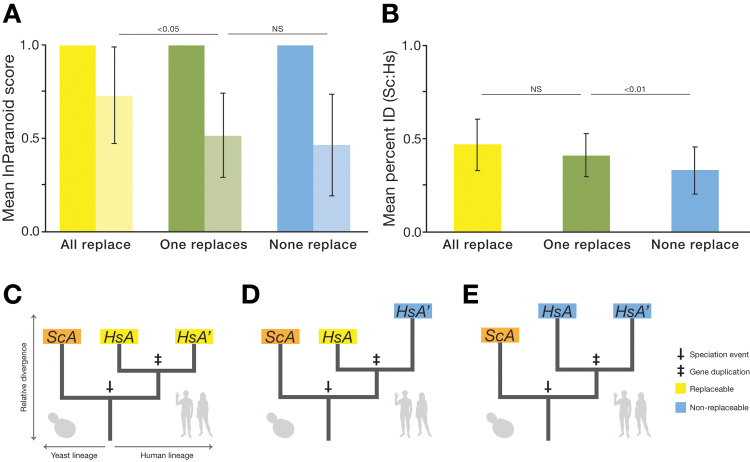
Fig 4. Replaceability is explained by relative divergence of 1:2 human co-orthologs from each other and their yeast ortholog.
(A) The average ortholog score of the more-diverged (lighter color) 1:2 co-ortholog is more similar to the less-diverged co-ortholog for co-ortholog pairs that both replace than pairs in which only one or neither of the co-orthologs replace. (B) The average percent amino acid identity for 1:2 co-orthologs is not significantly different between the “all replace” (yellow) class and the “one replaces” (green) class, whereas the “none replace” (blue) class is slightly, but significantly, lower than either. Error bars indicate standard deviation. Raw data for (A) and (B) are available in S2 Data. (C–E) Phylogenetic models depicting gene trees for generic 1:2 orthogroups in the various replaceability classes. In (C), the human co-orthologs belong to the “both replace” class and are thus less diverged from each other but are on average similarly diverged from the yeast ortholog as the “one replaces” class (D), in which the co-ortholog more closely related to the yeast gene is the one that replaces. In (E), the “none-replace” co-orthologs are on average more diverged from the yeast gene. Hs, H. sapiens; HsA, H. sapiens co-ortholog A; HsA′, H. sapiens co-ortholog A′; NS, not significant; ScA, S. cerevisiae ortholog A.

