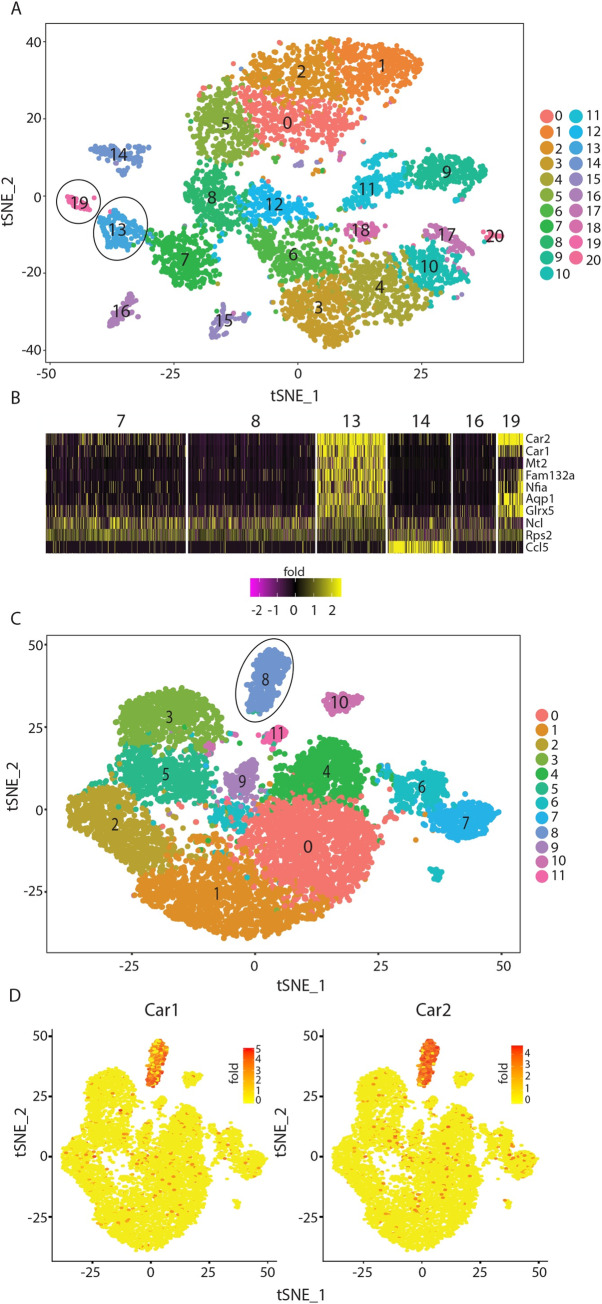
Fig 1. Carbonic anhydrase 1 and 2 are highly expressed by specific subsets of progenitor cells.
(A), t-distributed stochastic neighbor embedding (TSNE) plot illustrating defined clusters of cells generated by single cell RNA-seq of live, CD45+ CD19- CD3- Ly6G- bone marrow-resident cells. (B), Heat map illustrating the top 10 marker genes for cluster 13 and their expression levels in other relevant clusters. (C), TSNE plots from bone marrow samples downloaded from NCBI (GSE108097). (D), TSNE plots illustrating expression of Car1 and Car2 across clusters. (A), Generated by pooling bone-marrow cells from 3 individual mice.

